
New Car Sales
According to the figures produced by the SMMT, 161,013 cars were registered in January 2019, a reduction of 1.6% on last January’s 163,615. Once again, registrations of diesel cars saw the biggest drop, down 20.3% on January 2018. Petrol registrations were up 7.3% and alternatively-fuelled car volumes up 26.3%. Diesel continues its market share decline, with 29.1% of registrations now of this fuel-type. Whilst alternatively-fuelled cars continue to grow in popularity, they still only made up 6.8% of all registrations.
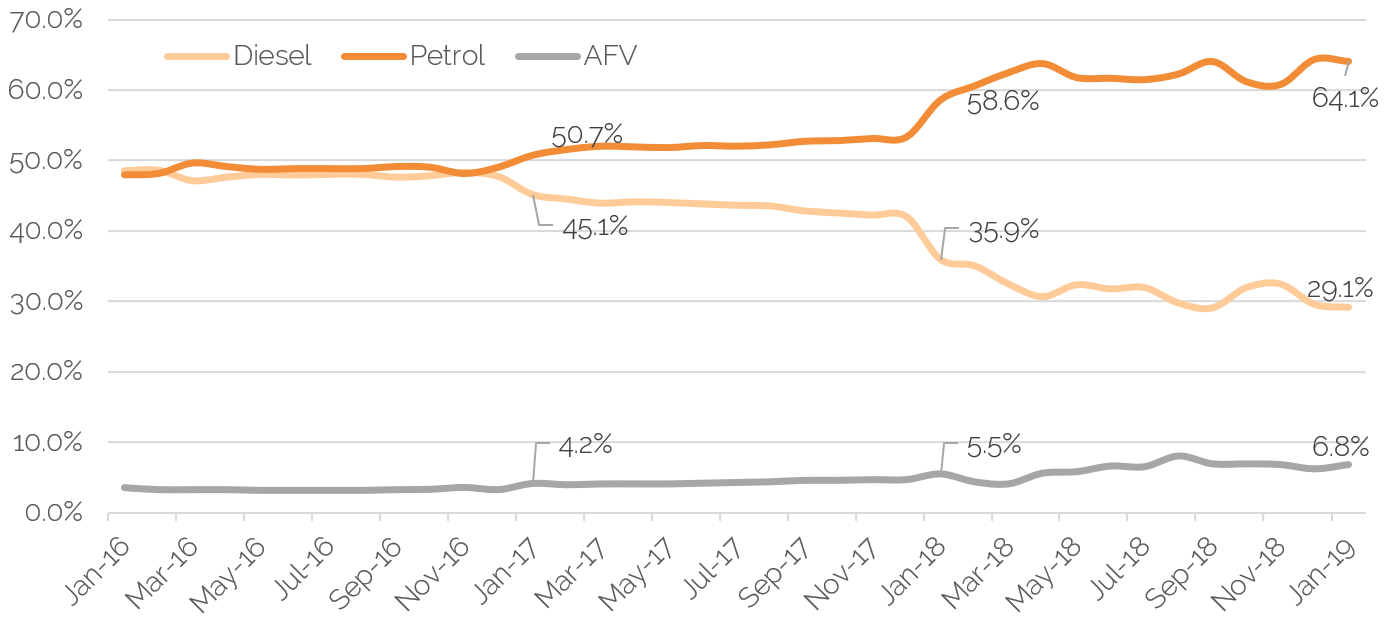
Source: SMMT
A 1.6% decline is not seismic and private registrations were actually up year-on-year, by 2.9%, with 71,378 cars registered, illustrating that consumer demand was relatively strong, it was the fleet and business areas where there were reductions; WLTP and maybe a degree of economic uncertainty affecting these segments.
The Ford Fiesta and Focus were the two best selling cars, closely followed by the Nissan Qashqai, Volkswagen Golf and Mercedes-Benz A-Class.
Used Car Retail Activity
Used car retail footfall and sales, in the main, were “steady”, according to the majority of the feedback received from retailers during the month. The start of the year is historically one of the busiest but so far, in 2019, the market has been relatively flat and a little inconsistent. Demand was present, but not at the same levels as it was at this time in recent years. A common phrase from retailers so far this year is “it is good but not great”.
Those retail operators which have been doing particularly well tend to be the ones who carefully and realistically price point at day one and work to small profit margins, with the aim of pulling the main profits from the finance package and part-exchange vehicle.
Once again, the high-end, more expensive end of the marketplace has suffered more than the mainstream area, with economic uncertainty resulting in a reluctance to buy big-ticket items.
Used Car Remarketing Activity
January and February are historically months where wholesale vendors of cars push prices up due to increased demand and lower supply. Whilst volumes were certainly not high, demand has not increased since the start of the year, so that hoped for “buying frenzy” has been conspicuous by its absence. The vibrant auction environment usually enjoyed at this time of year has been a little subdued, led by the retail market being slower than in previous years and a reluctance of retailers to pay more than they have previously, so as not to squeeze margins further.
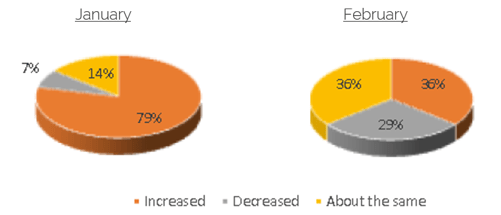
The latest cap hpi auction survey returned more mixed results than it has done previously. During January, stock levels increased for the majority, however in February, a key point is that for almost 30% of respondents, volumes declined.
How do your current stock levels compare to the previous month?
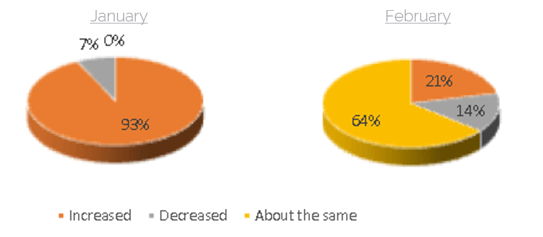
When considering trade demand in the auction halls, whilst January was not as strong as many hoped and expected, it was still an improvement on December and heading in the right direction. During February, it remained at that same level for almost two thirds of respondents, but once again, there was a mixed picture with both increases and decreases reported by different auctions. Certainly, a smaller number were painting a more positive picture than they were a month earlier.
How does trade demand compare to the previous month?
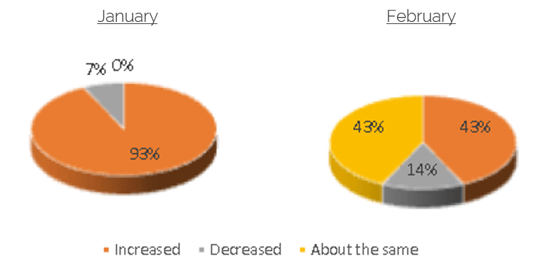
So what did this mean for conversion rates? There is a clear difference between the first two months of the year, with even some reports of conversion rates dropping – an unusual occurrence during the month of February. Overall, however the picture is generally positive, but the main point being it is not as positive as usual for this time of year.
How do conversion rates compare to the previous month?
The general feeling from the auction environment was that February 2019 was tougher than expected and tougher than in previous years.
Used Car - Trade Values
Over the last 5-years, the movement in Live values during February has either been a positive one or no average movement at all; last year, values went up by an average of 1%, with the market being particularly strong. At the 3-year age point, this averaged out to around a £150 increase in values. This time around, we have witnessed the first downward movement in the month of February since the recession of 2008.
It has to be said, however, that the downward movement in 2019 is for very different reasons. With average trade prices being higher than at the same point a year ago, by around 1%, what we are currently witnessing is a reluctance to pay more for cars, due to the pressure that this puts on retailers margins.
After strength in diesel car values over the last few months, these have started to slip away at a faster rate than those of petrol cars. Since the middle of last year, there has been little or no discernible difference between value movements of these two fuel-types, however during February, petrol car values dropped by 0.4% and diesel by 0.8%. It is too early to judge whether this is a trend that is going to continue, but a close eye will need to be kept, as half of the cars in the wholesale market are still diesel powered. The typical leasing age of cars, at 3-4 years old, remain predominantly diesel and will do for another year at least – the pronounced switch to petrol cars in the new car market was not evident until the start of 2017. As expected, smaller diesel cars were those under the most pressure as the desire for petrol is more acute in this size of vehicle.
There is some interesting detail within the February valuations. As mentioned previously, expensive cars have seen retail demand wane and as these tend not to be vehicles purchased speculatively for stock, wholesale demand has slipped too. This has resulted in prices dropping for these cars, with the executive sectors being the hardest hit of all, dropping by an average of between 1.5 and 2.1%. For a luxury executive model, this averages out at reductions of over £3,000 on a 1-year old and over £1,500 on a 3-year old car – significant amounts. These cars were also amongst the hardest hit in January too, so a theme is developing.
SUVs and MPVs also dropped in value by more than the average, both by 0.8%, which is generally between £150 and £225 on a 1-year old car. Interestingly, whilst the majority of models dropped in value, the Ford Kuga petrol and Toyota C-HR hybrid bucked the trend and proved popular, both going up by 1%. Petrol and hybrids are now more than acceptable fuel-types in the previously diesel dominated SUV sector.
It appears that the higher the value, the bigger the fall in percentage values recently. City cars and superminis both dropped by less than the average, -0.2 and -0.4% respectively at the 3-year point, which in monetary terms is almost negligible. Small cars with automatic transmission have generally increased in value, with supply levels low and demand reasonable.
The buzz around electric vehicles continues to grow with demand on an upward curve, particularly for the more affordable vehicles, aided by popular press reporting on low-emission zones. Like the rest of the market, however, higher ticket items remain under pressure and saw values move back. Renault Zoe and Nissan Leaf models increased in value again, with the Zoe going up by a significant 7%, or almost £1,000, on a 1-year old car, whilst the BMW i8, Tesla Model S and Jaguar i-Pace all dropped in value in February. For information, the London Ultra Low Emission Zone comes into play on 8th April 2019.
What Next?
With the outcome of Brexit still very much up in the air, there is much economic uncertainty prevailing. With this in mind it is very difficult to predict the next few weeks and months until the nature of any deal, or indeed no deal, is known.
Over the last few years, the value movements in March, an accumulation of cap hpi Live valuation movements during the month, have generally been positive. The average movement has been 0.2% up, with last year being a 0.4% positive movement. Much can depend on the new car market during this plate-change month, although the impact of large numbers of part-exchanges or keen, tactical pre-registration offers, on the used car market is usually delayed until April.
It is likely that March 2019 will see further stability in used prices rather than increases. Reluctance to pay more by the trade will likely continue and there may be a slight slowdown in the retail market, with franchised dealers focussing on new car activity, plus Brexit uncertainty meaning consumers may delay big-ticket purchases whilst awaiting economic clarity. How soon this materialises, however, remains to be seen.
In summary, it is likely that volumes in the wholesale market will decline over the next few weeks but demand is likely to do the same, resulting in a status quo. As always, however, supply and demand will be different for different sectors, models and maybe even fuel-types, so a keen eye on the detail within Live valuations remains essential.
black book March 2019 - Average Value Movements
|
|
1 YR/10K |
3 YR/60K |
5 YR/80K |
|
City Car |
(0.2%) |
(0.2%) |
(0.7%) |
|
Supermini |
(0.3%) |
(0.4%) |
(1.1%) |
|
Lower Medium |
(0.4%) |
(0.4%) |
(0.9%) |
|
Upper Medium |
(0.5%) |
(0.5%) |
(0.7%) |
|
Executive |
(0.7%) |
(1.5%) |
(1.7%) |
|
Large Executive |
(1.6%) |
(1.6%) |
(1.7%) |
|
MPV |
(0.8%) |
(0.7%) |
(0.7%) |
|
SUV |
(0.9%) |
(0.8%) |
(1.1%) |
|
Electric |
1.0% |
0.7% |
0.9% |
|
Convertible |
(0.9%) |
(0.4%) |
(0.4%) |
|
Coupe Cabriolet |
(0.8%) |
(1.3%) |
(1.4%) |
|
Sports |
(1.2%) |
(1.5%) |
(1.6%) |
|
Luxury Executive |
(2.0%) |
(2.1%) |
(2.2%) |
|
Supercar |
(1.2%) |
(0.9%) |
(0.6%) |
|
Overall Avg Book Movement |
(0.6%) |
(0.6%) |
(0.9%) |
( ) Denotes negative percentages
Notable Movers 1yr 20k
GENERATION NAME
MIN £
MAX £
AVG £
AUDI A3 (12- ) DIESEL
-500
-100
-340
BMW 1 SERIES (11-17) DIESEL
-400
-250
-288
BMW MINI COOPER (13-18)
100
150
102
FORD KUGA (12- )
100
200
146
LAND ROVER RANGE ROVER EVOQUE (11- ) DIESEL
-900
-400
-612
MERC A CLASS (12-18) DIESEL
-200
-100
-160
RENAULT CAPTUR (13- )
-150
-100
-115
VAUXHALL ASTRA (15- ) DIESEL
75
150
104
VAUXHALL MOKKA (12- )
-150
-100
-127
VOLVO XC60 (08-17) DIESEL
-600
-200
-313
Notable Movers 3yr 60k
GENERATION NAME
MIN £
MAX £
AVG £
AUDI A6 (11- ) DIESEL
-450
-250
-354
BMW 1 SERIES (11-17) DIESEL
-250
-150
-201
BMW X5 (13-18) DIESEL
-300
-200
-242
KIA SPORTAGE (10-16) DIESEL
-250
-150
-218
LAND ROVER RANGE ROVER (13- ) DIESEL
100
900
644
MERC E CLASS (13-16) DIESEL
100
200
151
MITSUBISHI OUTLANDER (14-18) HYBRID
100
150
133
TOYOTA YARIS (12-17) HYBRID
125
175
159
VAUXHALL ASTRA (09-16) DIESEL
-200
-150
-175
VOLKSWAGEN TIGUAN (11-16) DIESEL
-350
-150
-290

