
New Car Sales
As expected, March 2018 was a particularly interesting month for UK new car sales. According to figures released by the SMMT, 474,069 cars were registered, a reduction of 15.7% compared to the same month last year (562,337). However, it was still the fourth biggest March on record. Over the whole of the first quarter, 718,489 cars were registered, versus 820,016 in the same period of 2017 – a reduction of 12.4%. Last March, however, was the biggest month ever for new car registrations, due to changes to the Vehicle Excise Duty, with buyers taking the opportunity to purchase before these came into force on 1st April, 2017.
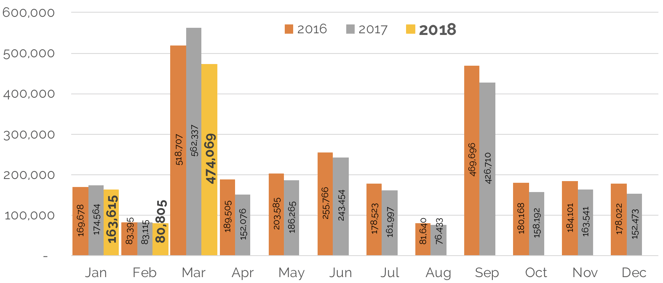
Source: SMMT
Fall in demand for diesel vehicles continued, this fuel-type making up just 32.4% of registrations in the month, down 37.2% versus March 2017. Uncertainty over fiscal legislation and confusion over environmental policy means that this is no longer the default fuel of choice for many, although high-mileage company car drivers still see the benefit of running one. Registrations of petrol cars were relatively stable – actually up by 0.5%.
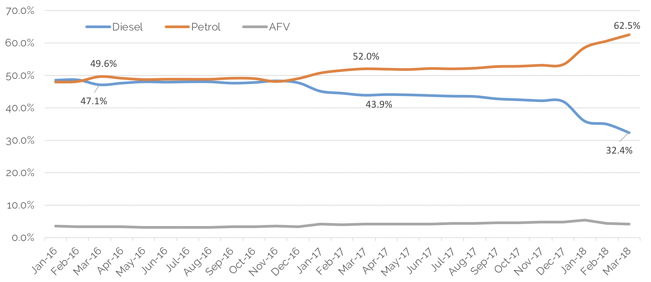 Source: SMMT
There was little discernible difference in the decline within sales types. Business, Fleet and Private registrations were all down between 14 and 16.5%. Daily Rental registrations were down 26.7% in the month and 17.4% year-to-date, although this was not down to a lack of demand. With less favourable exchange rates than in previous years and the previous recovery of new car markets in mainland Europe, certain manufacturers chose to build vehicles for other countries, meaning less cars for one of the least lucrative sales channels for manufacturers in the UK. However, what is slightly surprising is that whilst these cars were built for foreign shores, the appetite to take them was not necessarily there in March – new car sales in Germany and Italy were also down year-on-year and European car sales in quarter one were the weakest for five years, according to data from the European Automobile Manufacturers Association. The UK obviously played its part in this downturn.
Much of the reduction in the UK Rental area was from the 2 main volume players – Vauxhall and Ford – with brands such as BMW, Mercedes-Benz, Hyundai and Kia increasing their volumes compared to last year. It will be interesting to see if these trends continue, and if they do, whether there will be an impact on short-cycle residual values, be it positive or negative, for these brands.
Used Car Remarketing Activity
The end of March and the month of April is traditionally a difficult month for vehicle remarketing, with large volumes of part-exchanges and fleet returns hitting the auction halls just at the time the Easter holidays tend to lead to a drop off in retail demand. This year, there was also the weather – be it snow, rain or soaring temperatures – to throw into the mix.
Initially, wintry conditions and the school holidays did have a slight adverse impact on footfall at many auction sites – conversion rates dropped and stock inventory rose; those cars in good condition with the right specification continued to sell however. Once the holiday period was over, conversion rates increased and the supply/demand equilibrium returned. Towards the back end of April, however, the increase in stock levels accelerated and dealers could afford to be more selective, although conversion rates continued to hold up better than when compared to the same point in previous years.
With uncertainty over new car registration volumes, many franchised dealers are focussing more and more on selling used vehicles and that is keeping the remarketing sector particularly competitive – during the months of March and April that is more unusual than at other times of the year. Many of these franchised dealers are retailing more and more of the part-exchanges that they receive, rather than sending them straight to auction. They are also more prepared to retail vehicles from other marques than they have been in the past. As a result car supermarkets are not finding it as easy to source cars as they have previously.
Research completed by the cap hpi black book editors reports that healthy percentages of cap clean were being achieved by leasing companies remarketing their vehicles through auction, with conversion rates also above where they would normally expect them to be in April.
Trade Values
Rather than Easter being the watershed for used values as it has been in the past, the traditional drop off in demand was relatively short-lived – more of a blip than a turning point. Over the last 5 years, the black book live drop during April (leading to May’s monthly book) has been remarkably consistent – drops ranging from 1.4% at 3-years 60,000 miles in 2016 to 1.8% in 2013 and averaging 1.6% over all 5 years. This time around, the reduction has been far less acute – since August 2017 every month’s value movement has been a more positive one that the same month a year previous. The average drop has been a modest 0.8% at 3-years old, but as always there are different sectors and models behaving very differently within the marketplace.
One of the strongest sectors over previous months has been at the smaller end. In April, however, City Cars saw the largest decline in percentage terms of any volume sector – down 1.7% at the 3-year point and 1.8% at one year. As highlighted in last month’s editorial, certain cars in this sector have appreciated in value over the last year and it seems as though they may have now reached their peak - a reasonable retail price point is required as well as an acceptable gap from the price of a new car. However, it is important to state that this decline in prices was not as acute as during April 2017, when black book live values for City Cars dropped by an average of 1.9%.
SUVs remain the flavour of the month for many consumers, with almost one third of new cars registered being an SUV of some variety. Looking at the used car market, in the last 10-years the volume of SUVs within sold data analysed by cap hpi shows a six-fold increase, now making up almost 20% of the data received – this is only going to increase, bearing in mind the new car market. Currently supply and demand seem well matched, with values generally performing in line with the overall market. However, some weakness has been noted within smaller SUVs and these have moved down in percentage terms by more than their larger counterparts – there is now intense competition amongst manufacturers for this size of vehicle and models such as the Toyota C-HR, Skoda Karoq and SEAT Ateca have all moved down in value. Consumers are now spoilt for choice for this type of vehicle.
As is normal at this time of year, although slightly delayed this time around due to inclement weather, convertible prices are rising. This is one of the few sectors where cars remain a seasonal purchase. Values increased in April by a modest 0.7% at 3-years, 60,000 miles.
In the Upper Medium and Executive sectors, newer used vehicles struggled more than other ages and other volume sectors. Vehicles of 2-years old or younger seem to have been fairly plentiful, in no small part due to Personal Contract Hire cars returning to the market. Some examples of cars that have struggled and dropped in value are certain petrol Audi A4s, BMW 3-Series GT Diesel and Volvo V90 and S90 Diesels. This sector perfectly illustrates how, on the other hand, well matched supply and demand can lead to stability, with BMW 3-Series (12- ) Diesel, Ford Mondeo (14- ) Diesel and Audi A4 (15- ) Diesel values all remaining static.
On this note, with diesel registrations declining in the new car market, it is important to state that in the used arena demand has remained steady. Good condition vehicles currently make strong money whatever their fuel-type – indeed due to petrol variants actually increasing in value over recent months, certain diesel cars now look good value for money. As well as being strong in the Upper Medium sector, many SUV diesel values have either increased or stayed level, whereas their petrol counterparts have declined. Some examples of this are the Renault Kadjar, Renault Captur, Citroen C4 Cactus and Honda HR-V. Feedback from trade buyers is that there is little or no resistance from consumers to buying used diesels. Indeed, on average diesel values dropped by 0.7% in April’s live product, whereas petrol dropped by 0.9%. With over half the cars registered in 2015 and 2016 being diesels, it is important for values that this demand remains.
On the other hand and perhaps somewhat surprisingly, values of hybrids declined more than other fuel-types in April. Reasons for this are that many hybrid models look expensive when compared to a more traditional petrol or diesel vehicle and supply levels have increased – models such as the Golf GTE and Audi A3 E-tron have recently entered the used market creating more competition and pressure on prices.
Values of electric cars have been more mixed, and very much down to supply versus demand. Tesla Model S and Golf E values have increased, whilst the BMW i3 now has increased used volumes available and values dropped by 3% during the month. In the first quarter of 2018, the volume of electric cars within our sold car data is at almost 40% of that received in the whole of 2017. Supply is increasing, but also consumers are far more likely to purchase an electric car than they were a year ago.
What Next?
Undoubtedly the last few months have been positive for the used car market, leading to some within the industry to call 2018 the Year of the Used Car. So, is this strength likely to continue in the short-term?
With new car registrations reduced, part-exchanges are not so plentiful as they were at this point last year and dealers are focussing more on used cars. Therefore supply and demand are well matched. Used car finance is also more and more commonplace, with monthly payments rather than outright purchasing becoming the norm. Whilst all this is the case, values are likely to hold firm. On the flip side, as previously mentioned, the usual velocity in value reductions has not been present for 10 months now and used car values are undoubtedly high. Also, as stated, March 2018 was still the 4th highest March registration month on record, so there is not exactly a shortage of part-exchange supply and it has almost certainly not peaked just yet.
What is likely is a fairly gentle downward trajectory for used car values – the average movement over the last 5-years has been a drop of 1.7% through May. Bank Holidays, particularly if accompanied by summer weather, tend to result in a drop off in retail demand, so trade buyers have less requirement to replenish their stocks.
It will be interesting to see whether diesel price movements will continue to outperform petrol and hybrid. It would certainly appear that the latter two have peaked, but with the proportion of used diesel supply high for some time yet, will demand match it? In the medium term this may well depend on any future legislation regarding fuel levies or excise duty changes or on if there is a rise in the number of clean air zones around the country.
With the interesting and different dynamics in the new and used car market in 2018, it is more important than ever to view individual values daily throughout the month, particularly with prices higher than normal and the ever-present possibility of the market dipping away. Attention to detail is very much the key to profitability, knowing where and when to buy and sell.
black book May 18 - Average Value Movements (Plate Uplift Excluded)
|
|
1 yr/10k |
3 yr/60k |
5 yr/80k |
|
City Car |
(1.8%) |
(1.7%) |
(0.7%) |
|
Supermini |
(0.4%) |
(0.7%) |
(0.6%) |
|
Lower Medium |
(0.8%) |
(1.2%) |
(1.0%) |
|
Upper Medium |
(1.0%) |
(0.7%) |
(0.5%) |
|
Executive |
(1.0%) |
(1.0%) |
(1.7%) |
|
Large Executive |
(2.5%) |
(2.5%) |
(1.8%) |
|
MPV |
(0.4%) |
(0.4%) |
(0.6%) |
|
SUV |
(0.9%) |
(0.8%) |
(0.2%) |
|
Electric |
(0.3%) |
0.0% |
(0.3%) |
|
Convertible |
(0.0%) |
0.7% |
0.9% |
|
Coupe Cabriolet |
0.3% |
0.8% |
1.6% |
|
Sports |
(0.4%) |
(0.2%) |
(0.3%) |
|
Luxury Executive |
(0.1%) |
(0.1%) |
(0.2%) |
|
Supercar |
(0.0%) |
(0.0%) |
0.4% |
|
Average Movement |
(0.8%) |
(0.8%) |
(0.6%) |
( ) Denotes negative percentages
Notable Movers 3yr 60k
Generation Name
Min £
Max £
Avg £
AUDI A1 (10- )
50
300
128
AUDI A6 (11- ) DIESEL
-450
-250
-317
AUDI Q3 (11- ) DIESEL
-500
-350
-418
BMW 1 SERIES (11-17) DIESEL
-200
175
-159
FORD FOCUS (11- )
-525
-100
-208
FORD KUGA (12- ) DIESEL
-250
-175
-219
HYUNDAI I10 (14- )
-175
-125
-144
JAGUAR XF (11-15) DIESEL
-350
-200
-290
KIA CEED (12- ) DIESEL
-225
-175
-196
LAND ROVER RANGE ROVER EVOQUE (11- ) DIESEL
-300
-200
-247
MERC A CLASS (12- ) DIESEL
-250
-50
-143
MERC C CLASS (14- ) DIESEL
-200
-100
-147
MERC E CLASS (13-16) DIESEL
-200
-100
-154
NISSAN QASHQAI (13- )
-325
-150
-203
SEAT IBIZA (12-17)
-175
-75
-108
TOYOTA AYGO (14- )
-250
-150
-205
TOYOTA YARIS (11-17)
-150
-100
-129
VAUXHALL INSIGNIA (13-18) DIESEL
-200
-125
-152
VAUXHALL MOKKA (12- )
-325
-150
-235
VOLVO XC60 (08-17) DIESEL
250
300
285

