
New Car Sales
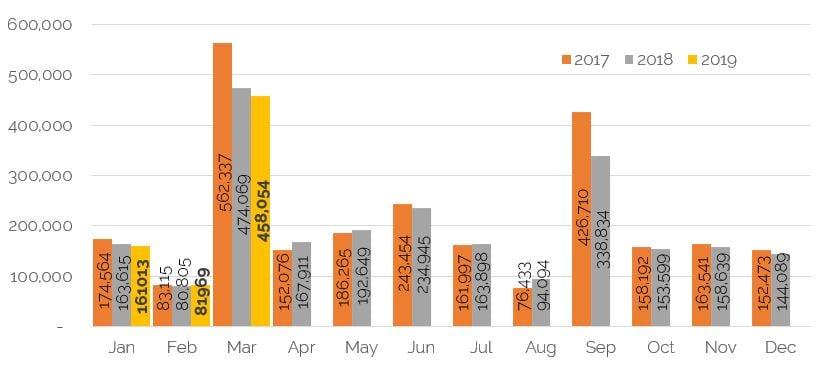
According to the figures reported by the SMMT, 458,054 cars were registered in March 2019, a reduction of 3.4% from the 474,069 in the same month last year. Year-to-date, 701,036 cars have been registered, a reduction of 2.4% on the first quarter of 2018, when the figure was 718,489. Brexit uncertainty was cited by the SMMT as part of the reason for the shortfall, whilst there were also some supply issues for certain manufacturers. Other brands were active with financially attractive “pre-registration” offers to dealers, to boost their figures, as can be seen when analysing the volumes of cars with “19” registration plates advertised online as used cars.
 Source: SMMT
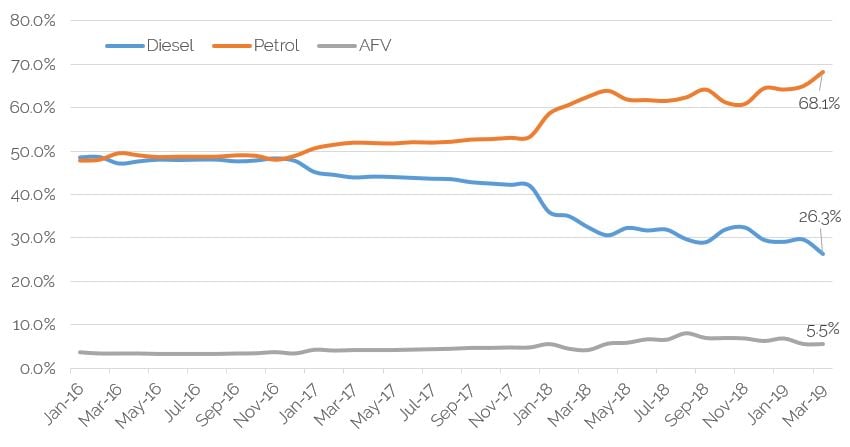
Registrations of diesel cars continued their decline, down 21.4% for the month, compared to March last year, and amounting to just 26.3% of the market. Petrol cars took up most of the diesel reduction, with a 5.1% increase and market share of 68.1%. Alternatively-fuelled vehicles continued to increase in number, by 7.6%, with a share of 5.5%.
 Source: SMMT
As always, analysis of the daily rental registration volumes proved interesting. The majority of these cars tend to be on short holding periods, so appear in the used car sales arena within 6-12 months of first registration, with, depending on volumes by model, a potential impact on price. This is also one of the lowest profit sales channels for manufacturers, so high volumes of registrations can be a sign of lower demand elsewhere. March 2019 saw almost 6,000 more cars registered in daily rental than in the same month last year, off the back of the two previous months this year being slightly subdued. This could be a further sign of natural demand, particularly by the consumer, slowing down (“private” registrations were down 2.8% compared to last March).
According to the SMMT, Vauxhall registered over 22% of all daily rental cars in March (21% year-to-date), with the Insignia and Mokka X being the highest volumes. So far, in 2019, Vauxhall, Mercedes-Benz and Renault take up the top 3 places in volume terms, and, whilst Ford occupy 4th position, they have significantly reduced their volumes in this channel over the last 15-months. Time will tell on any impact on used car values for these brands.
Some manufacturers had ramped up the volumes of new cars built in quarter 1, concerned by the now defunct Brexit deadline of 29th March and potential tariffs. They wanted stock on the ground in case a pre-deadline sales push was required. As these cars were built, they were keen for them to be registered – hence some of the tactical registration activity. This continued in April and towards the end of the month, the signs were that April would be ahead of last year, in terms of volumes.
Used Car Retail Activity
The month of April is traditionally one where consumer demand for used cars drops away, although the severity and timing of this decline can depend on when Easter and the school holidays land. This year, with the vacation period starting from the early days of the month, demand dipped very early on and the summer-like weather towards the end of the period only exacerbated matters.
With franchised dealers under pressure to achieve new car targets agreed with their respective manufacturers, used car buyers were switched into new or pre-registered stock. With monthly payments now the norm, this is an easier sell than it once was, particularly as, for certain brands, cars were readily available, with no lead times.
As always, however, there were pockets of strength for used cars, particularly amongst the car supermarkets and independents who do not have this pressure. To continue a theme from previous months, cars that are more expensive were certainly in less demand than more mainstream offerings and supermarkets and independents focussing on slightly older stock did still sell cars in what they described as “reasonable” volumes.
Used Car Remarketing Activity
The trade, remarketing area of the market was more affected by the seasonal downturn than retail. With stock levels already high, the fall in consumer demand meant less of an appetite to purchase than in recent months. Add to this reports of many franchise dealers being out of the market, focussing on new cars or retailing part-exchanges, since March, the used car market suffered a downturn.
With demand lower it was almost inevitably the cars in “average” and “below” condition that tended to be ignored.
During April, the majority of remarketing contacts were advising that demand, conversion rates and prices were all dropping and the April Auction Survey illustrates this.
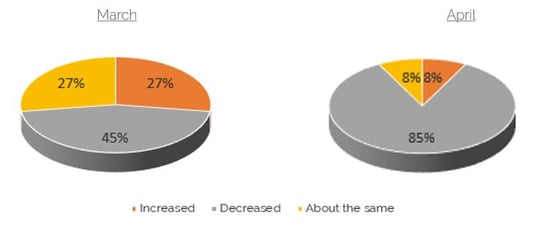
How does trade demand compare to the previous month?
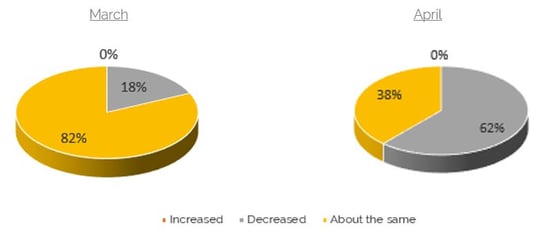 As the charts show, last month 18% of respondents advised that demand had dropped, in April this rose to almost two-thirds. A fairly healthy 38% still reported a similar picture to March, however.
How does trade demand compare to the previous month?
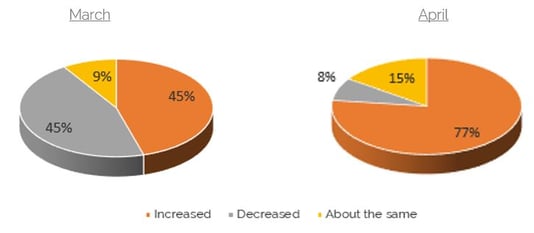
The number of respondents citing increases in stock levels rose from 45% in March to 77% in April as supply outweighed demand.
How do conversion rates compare to the previous month?
Conversion rates dropped for 85% of respondents – a much clearer picture than the mixed one reported last month. Feedback suggested that they had dropped from between 60-70% to as low as 40-50% in late April, quite a concern for some of the auction and defleet compounds, as clearly the lower conversions plus new stock arriving could cause logistical and storage headaches going forward.
Used Car - Trade Values
Easter is often described as a watershed for used car values, the time of the year when they tend to take a downturn after a strong first quarter. This year, however, that earlier strength did not materialise – values have been moving down consistently since November last year – initially this followed traditional quarter 4 patterns but once we entered 2019, values continued to drop when in previous years they have been stable or even risen.
Live valuations during April certainly fell, but this was more of a continuation of a theme rather than a watershed.
After 18-months of market strength, the perfect storm hit during the month. Used values were already high, with little or no appetite by retailers to either push prices to the consumer up or squeeze their margins further, supply increased from part-exchanges and fleet returns generated by the “19” plate and demand dropped for the reasons already mentioned. Those buyers that were active took advantage of the situation, offering below previous cap values for the vast majority of cars. This led to the largest accumulated monthly drop, of 2.3% at the 3-year point, seen in Live valuations since December 2015 and the largest drop during an April since 2011.
There has been some scaremongering in the used market surrounding these value drops, with some even comparing to what happened during the recession of 2008; there is no comparison, however. The main reasons are outlined above and there is no suggestion that large price drops are a likely theme from now on. In 2008, access to finance was a key driver – that is not an issue in 2019.
All mainstream sectors were affected by the April downturn, with city cars and superminis the hardest hit in percentage terms, dropping by 2.8% and 3.1% respectively. Put into context though, even at these relatively high percentages, the drops were generally between £150-225. After values rose for many cars in these sectors in 2018, they are now in deflation, which is to be expected as models age within their lifecycle.
With almost one quarter of cars within the cap hpi trade disposal data now being an SUV of some shape or form, it was unsurprising that values within this sector fell in line with the market, dropping by an average of 2.2% or nearly £300. With volumes increasing, there was more choice for the lower number of buyers, so prices fell. As always, with the level of detail analysed by the cap hpi Valuations Editors, there were contrasting fortunes for different models in this sector. The previous variant of the Audi Q3 Diesel, current Audi Q8 Diesel, BMW X1 Diesel, BMW X2 Petrol and Citroen C4 Aircross Petrol and Diesel variants all dropped by someway more than the average. However, there were also some models where supply did not outweigh demand and the Skoda Kodiaq Petrol, Suzuki Ignis and Toyota C-HR Hybrid all increased in value. No mean feat in a falling market.
It was a particularly interesting month for what has been one of the most robust sectors in the last 12-months – the lower medium or C Sector, which includes cars such as Ford Focus and Volkswagen Golf. Despite the increase in popularity of the SUV, this size and shape of car has proved popular in the used car market, taking volume away from both superminis and upper medium (D segment) cars, for different reasons. In April, however, pressure was certainly put on prices, and in particular on values of diesel cars. Whilst diesel as a fuel-type has remained popular in the used market, this has generally been for larger cars. Diesel, lower medium car prices dropped by an average of 3.3% or £300, whereas petrol variants dropped by a lower amount (2.6% or £225), whilst hybrids, with lower supply closer matched by demand dropping by just 1.3% or £150. A close eye will be kept to see if a pattern is developing for this sector. Some petrol models that increased in value were the BMW 1-Series and the DS4, whilst a number of hybrids increased in value – such as the Toyota Corolla, Toyota Prius and Volkswagen Golf.
Over all sectors, diesel used values were slightly more affected by the downturn than petrol ones and it will be interesting to see if this continues.
There was again inconsistency for electric vehicles. Whilst the Renault Zoe seems to have reached a price point now, having increased extraordinarily in the last 12 months – it stayed level in April, the Peugeot iON and Hyundai IONIQ both went up in price. At the top end of the market, some confusion surrounded Tesla pricing as new car list prices dropped on certain variants – this almost immediately washed through to the used market and both the Model S and Model X dropped in value – the latter by almost 8% (c.8,000 for some trims on the newest plates).
What Next?
So what will the next month or so bring for the used car market? With Brexit fears on the backburner for the time being – the deadline now pushed back to the end of October – this is unlikely to have any effect on the used car market, at least in the short-term.
There will undoubtedly be the natural impact of high stock levels for some time to come, off the back of increased supply and lower sales rates in the last few weeks. This will likely have an impact on values as we move through May, particularly as demand will be affected by the two Bank Holidays and school half-term.
A keen eye will need to be kept on prices of diesel cars, particularly at the smaller end. 2019 is likely to witness a large number of returns into the market off the back of high registrations in 2016, before petrol took over as the highly dominant fuel-type. The traditional 3-year return point is not quite as prevalent as it was in the past, due to the PCP and PCH payment forms seeing cars returned at alternative ages, but the fleet arena still tends to defleet around this age.
It will also be interesting to analyse, over the coming months, whether the recently launched Ultra Low Emission Zone (ULEZ) in London has any effect on prices in the surrounding area.
The average movements of all fuel-types in Live valuations during May, over the last 5-years, has been a drop of 1.6%, with even last year, dubbed the “Year of the Used Car” witnessing a drop of 1.3% in that month.
It would be a surprise if prices did not continue to realign downwards, similar to these previous percentages, although as always this will not be across the board. Those manufacturers managing the return of their cars well into the market may see some benefit, although there can tend to be some relativity between prices of certain cars within the same sector.
Live valuations become even more important when prices are on the wane, to ensure vendors do not hold out for unachievable prices and buyers do not pay over the odds. As always cap hpi Live Valuations will report real-time as prices change during the month.
black book May 2019 - Average Value Movements
|
|
1 YR/10K |
3 YR/60K |
5 YR/80K |
|
City Car |
(2.4%) |
(2.8%) |
(2.9%) |
|
Supermini |
(2.4%) |
(3.1%) |
(3.7%) |
|
Lower Medium |
(2.5%) |
(2.9%) |
(3.4%) |
|
Upper Medium |
(2.0%) |
(2.4%) |
(2.8%) |
|
Executive |
(1.6%) |
(2.3%) |
(2.6%) |
|
Large Executive |
(1.0%) |
(0.8%) |
(1.6%) |
|
MPV |
(1.5%) |
(1.7%) |
(2.0%) |
|
SUV |
(1.8%) |
(2.2%) |
(2.6%) |
|
Electric |
(1.9%) |
(2.4%) |
(1.1%) |
|
Convertible |
(0.4%) |
(0.4%) |
(0.9%) |
|
Coupe Cabriolet |
1.3% |
1.2% |
0.8% |
|
Sports |
(0.6%) |
(0.7%) |
(1.1%) |
|
Luxury Executive |
(0.9%) |
(0.6%) |
(0.8%) |
|
Supercar |
(1.4%) |
(1.5%) |
(1.2%) |
|
Overall Avg Book Movement |
(1.9%) |
(2.3%) |
(2.7%) |
( ) Denotes negative percentages
Notable Movers 1yr 20k
GENERATION NAME
MIN £
MAX £
AVG £
AUDI Q3 (11-19) DIESEL
-1,000
-700
-823
BMW 3 SERIES (12- ) DIESEL
-750
-400
-567
FORD KUGA (12- ) DIESEL
-550
-250
-344
LAND ROVER RANGE ROVER EVOQUE (11- ) DIESEL
-1,000
-600
-783
MERCEDES-BENZ C CLASS CABRIOLET (16-18) DIESEL
400
450
442
NISSAN X-TRAIL (14- ) DIESEL
-600
-300
-440
VAUXHALL INSIGNIA (13-18) DIESEL
-700
-475
-573
VAUXHALL MOKKA (12- ) DIESEL
-450
-200
-248
VOLKSWAGEN GOLF (14-16) HYBRID
200
250
225
VOLKSWAGEN PASSAT (14- ) DIESEL
-650
-350
-498
Notable Movers 3yr 60k
GENERATION NAME
MIN £
MAX £
AVG £
AUDI A3 (12-19) DIESEL
-650
-200
-483
BMW 4 SERIES CONVERTIBLE (13- )
500
750
585
BMW MINI COOPER (13-18)
-525
-350
-428
FORD FOCUS (11-18) DIESEL
-550
-200
-324
HONDA CR-V (12-19) DIESEL
-650
-375
-508
LAND ROVER RANGE ROVER (13-18) DIESEL
-3,100
-1,100
-1,425
SKODA OCTAVIA (13- ) DIESEL
-600
-350
-437
TOYOTA YARIS (12-17) HYBRID
-375
-275
-346
VOLKSWAGEN GOLF (13- ) DIESEL
-500
-200
-263
VOLKSWAGEN TIGUAN (11-16) DIESEL
-600
-325
-443

