
New Car Sales
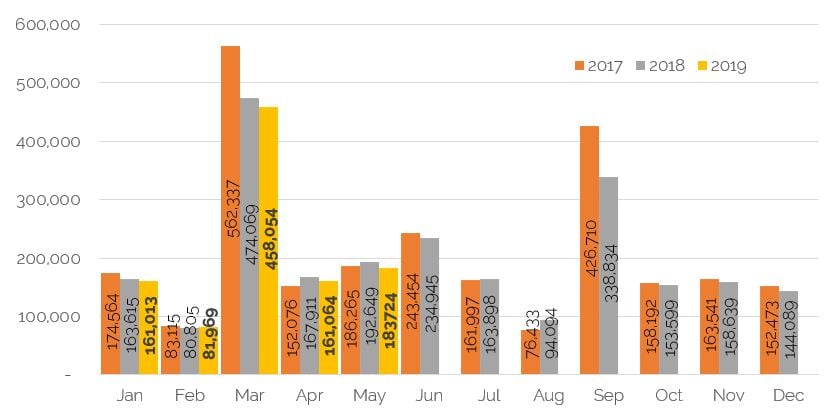
According to figures produced by the SMMT, the UK new car market fell by 4.6% in May, with 183,724 registrations, compared to 192,649 in the same month last year. Year-to-date, to the end of May, 1,045,824 cars were registered, down 3.1% on last years’ 1,079,049. The Private, Fleet and Business areas all experienced reductions. It will be interesting to see manufacturers’ individual results in the quarter end figures to the end of June, with reports of many retailers struggling to achieve targets and potentially needing to self-register to receive desired bonuses.
 Source: SMMT
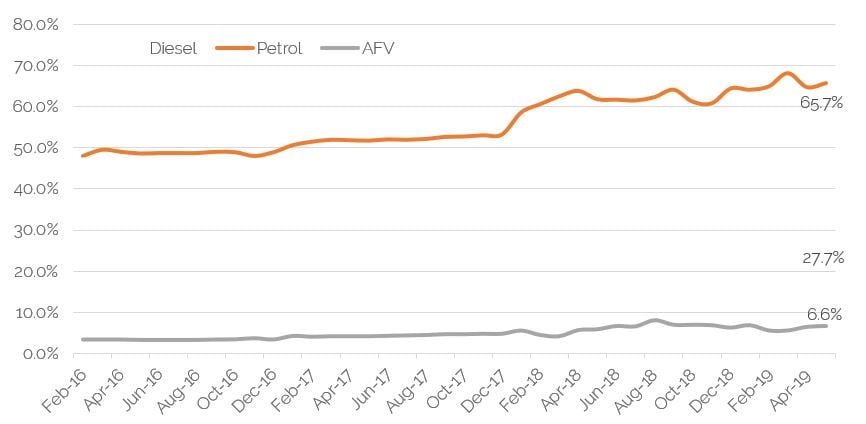
Diesel registrations continued to fall, remaining well below 30% of the total, when they used to regularly be around half. They were down 18.4% year-on-year, whilst petrol registrations were up 3.6%. Alternatively-fuelled cars take up 6.0% of the market so far in 2019, up 13.8%.
 Source: SMMT
With overall registrations down and reports of a tough retail market, it is unsurprising that Daily Rental Registrations continued to increase. One of the least profitable sales channels for manufacturers, and one of the most influential on used car values, becomes more important when there is a necessity to move stock or a desire to chase volume and market share. According to the SMMT, Vauxhall continue to lead the way, registering over 5,000 rental cars in the month, compared to less than 4,000 in May last year, this being over 40% more than Ford, their nearest competitor (85% more than them year-to-date). However, the top volume model in the month was actually the Ford Focus, as Vauxhall spread their risk around a number of popular models. Year-to-date, Mercedes-Benz, Renault and Peugeot have also posted increases, but Vauxhall remain far-and-away the dominant performer, with almost 20% of the rental market. It will be interesting to note the continued impact on residual values.
Used Car Retail Activity
The used retail market during June was challenging and lacking a consistent pattern, similar to the new car market.
Many franchise dealers concentrated more on new cars to hit those important quarterly targets, whilst also still balancing the need to sell their pre-registered cars that remain in stock. Monthly payment plans can make that switch easier than up front outlays that were more common in the past.
Car supermarkets and independents have also found the market challenging in recent weeks, having to work hard to convince many visitors to their sites to actually purchase, particularly as footfall was down, so there was a definite requirement to convert those that did enquire into actual sales.
Overall, consumer demand, whilst challenging, was stronger than it had been in April and May, with no distractions of school and Bank Holidays, but generally, enquiry levels and footfall were not as strong as in June in recent years. Cars were selling, but not flying off the shelves, although the situation improved slightly as the month progressed.
Looking at how long cars were being advertised for, last month we reported that this was around the 45-day mark, having previously been much shorter. Towards the end of June, this was at a similar number, although there are always many variations in this metric between brands, fuel-type, sector, outlet and region, amongst others. Certainly, cars are not being sold as quickly as they were a few months ago.
Used Car Remarketing Activity
With this slightly muted retail market, it is no surprise that this had a knock-on effect on the remarketing arena, with less of a requirement from retailers to replenish stock than at this time in previous years.
A constant theme throughout the month has been inconsistency in remarketing performances between location, vendor and even day. Just as vendors thought things were improving, a poor sale, or poor couple of days, brought them firmly back down to earth.
At the auctions, as the month progressed the picture improved slightly, with footfall and bidding activity both increasing, albeit many potential buyers were being selective – only interested in well-specified cars in cap clean condition with sound provenance. There is no shortage of cars in the market and, at times like this, it is those in poorer condition that struggle to sell. Online bidders in particular not being prepared to take a risk or buy cars that will require refurbishment, focussing on the better-graded cars.
Vendors that were in tune to the market in real-time, that tracked Live valuations and were prepared to adjust pricing to the condition of the car, in other words sell to “cap average” or “below” rather than “clean” saw the highest conversion rates. With values continuing to realign during the month, this was vitally important. Some vendors did seem to be in denial regarding just how tough the market was and that reserves required reviewing regularly.
Feedback from the auction companies, via the cap hpi auction survey, suggested things were tough, but improving month-on-month.
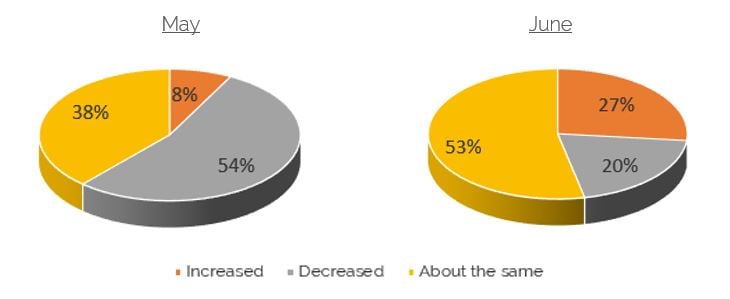
How does trade demand compare to the previous month?
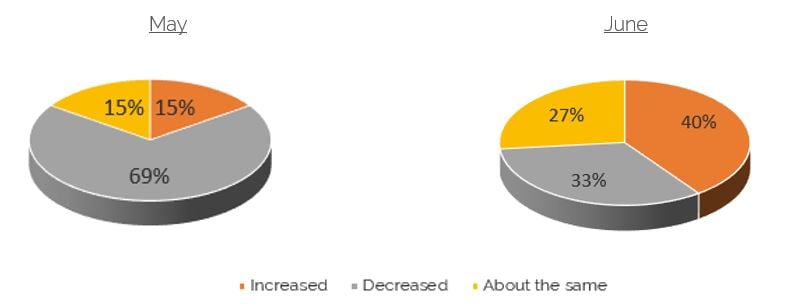
In May, a fairly negative picture of demand was painted, with the majority advising decreases. In June, 40% of respondents saw an increase in demand – green shoots of recovery, thankfully not washed away by some of the inclement weather experienced. One-third, however, still saw demand decreasing, illustrating well the inconsistency in the market between different sites.
How do your current stock levels compare to the previous month?
There was also a mixed picture over stock levels, but with almost half suggesting volumes were down, maybe some relative stabilisation of market prices could be around the corner, particularly if you bake in the slightly stronger demand reported. However, over one quarter were still seeing volumes on the increase.
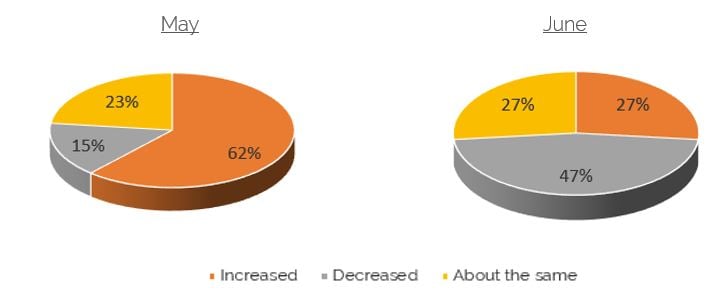
How do conversion rates compare to the previous month?
 Once again, feedback was inconsistent on conversion rates, but a more positive view than in May, when over half saw these diminishing. In June, whilst 1 in 5 respondents did see a worsening picture, 80% were reporting either parity from the previous month or a more positive picture.
Considering these three metrics, there are reasons to be quietly optimistic for the upcoming period, after a difficult couple of months.
Used Car - Trade Values
With a slightly subdued retail and wholesale market, plus fairly high stock levels in the used market overall, it is unsurprising that prices have continued to fall.
As can be seen by the graph below, 2015 and 2016 were two years that experienced high levels of new car registrations. With many fleet and PCP contracts being 36-months in length, plus last years’ WLTP issues causing contract lengths to be extended, many of these cars have returned, or are returning, to the used car market in 2019.
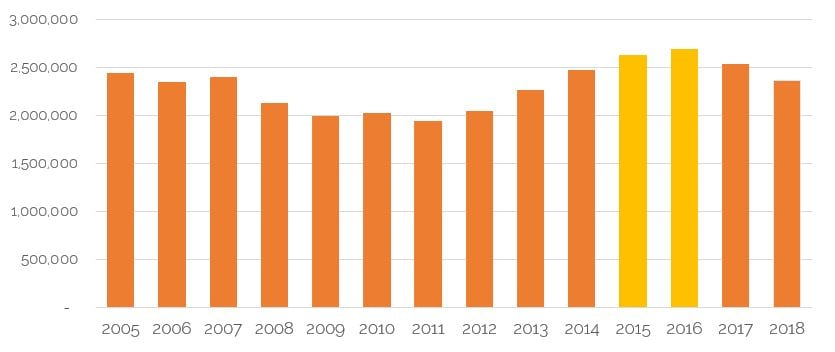
Simple supply and demand dynamics come into play, plus the fact that for a period in 2017 and 2018, used car prices actually inflated. As a result, prices have been under pressure, with a reluctance by buyers to pay more, as they generally cannot pass these increases onto the consumer. As a result, used car prices have realigned, resulting in cap valuations reflecting this. In effect, prices have been dropping for 9-consecutive months now, with the last 7-months experiencing heavier drops than in the corresponding month a year previous.
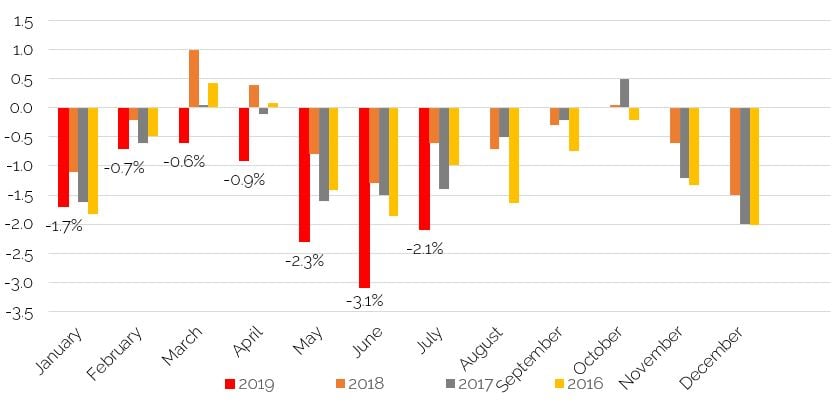
It is not unusual for values to drop during June, but there was some expectance that the previous two months drop in values would kick start things somewhat, with cars more reasonably priced. The drop that has occurred, however, is less than those experienced in April and May, so could be seen as a sign of a stabilising market.
The average drop in Live values in June, at the 3-year, 60,000 mile point, was 2.1%, following 2.3% in April and 3.1% in May. Whilst this could be looked at as continued weakness (the average drop in June over the last 5-years being 1.1%), we see it as more of a stabilisation after at least two turbulent months for prices. A 2.1% drop is still significant – an average of over £200 reduction – but after such a strong market in 2017 and 2018 there was always likely to be a period of realignment.
All sectors have been affected by this continued realignment of values, even upper medium cars (Mondeo, Passat size), which arguably are at a level where they are reasonable value compared to SUVs of a similar size, dropped by 2.3%. Convertibles have been an interesting sector in 2019, with overall a complete lack of the seasonal uplifts usually experienced in the spring and early summer months. They have been affected by the falling market and a reluctance amongst consumers for big-ticket, luxury purchases.
As always, by the nature of interrogating data at generation and derivative level, there are some models that have bucked the trend, where demand has outweighed supply. Whilst it is not uniform across all electric vehicles, interestingly two models with the same body shell – the Vauxhall Ampera and Chevrolet Volt did see an increase in values. These cars were possibly ahead of their time when they were introduced 7-years ago and are now at a reasonable price, with their “extended range” nature proving a popular choice, suitable for both long and short journeys.
Diesel car values have, on average, dropped by more than petrol ones once again. Whilst the difference in value drops are not dramatic, this has now happened every month in 2019, by varying degrees. There is no anti-diesel rhetoric overall, but perhaps it was inevitable that demand for diesel cars would slowly decline. Petrol hybrids performed the strongest of any fuel-type, dropping by less than the average, as their relative popularity increases.
What Next?
The big question is will these heavier than normal price drops continue in the coming months?
The average movement in Live values during the month of July over the last 5-years has been a reduction of 1.1%, with the heaviest drop during that time being 1.6% in 2016. Whilst there have been recent signs of stability and used cars are at a more realistic price than they may have been in the recent past, there is still the likelihood of price drops at least in line with previous years.
Looking slightly further forward, we still do not predict any adverse effect of Brexit on used car prices, but political uncertainty is by no means helpful to the industry as a whole, and we await to hear whether our next Prime Minister is a Boris or a Jeremy and what this means for the country. As the latest Brexit deadline looms closer, we will obviously keep a very close eye on any impact, although as stated previously the impact could be a positive one, at least for used cars.
There is also the upcoming next phase of WLTP, with a deadline of 1st September 2019 for Real Driving Emissions (RDE), with cars having to achieve NOx targets in real-world driving conditions. The recent announcement of derogation, allowing a certain volume of dealers’ non-RDE compliant cars to be sold for a further 12-months, if built before 3-months prior to 1st September, should help avoid any large-scale disposal of cars into the market.
Overall, we do not expect anything untoward to happen to prices in the next few weeks or months. In the short-term, values will likely drop further, but in line with July of previous years and not to the degree they have done in the last 3-months.
As was illustrated by the Ampera and Volt examples, and there are many more models that did not drop at the same rate as the average, it is vitally important to keep a close eye on Live values. Cap hpi valuations are based off real-time wholesale transactional prices in the market (around 170,000 each month) and react to changes as they happen, being reviewed by experienced editors. These trade prices are corroborated by also analysing retail data, although it is clear that at times when the market is as volatile as it has been, advertised prices do not move anywhere near as quickly.
Cap hpi Live Valuations will continue to track and report any price realignments, based off this transactional data, throughout July.
black book July 2019 - Average Value Movements
|
|
1 YR/10K |
3 YR/60K |
5 YR/80K |
|
City Car |
(1.9%) |
(2.0%) |
(2.6%) |
|
Supermini |
(1.2%) |
(1.9%) |
(2.6%) |
|
Lower Medium |
(2.1%) |
(2.5%) |
(3.2%) |
|
Upper Medium |
(1.9%) |
(2.3%) |
(2.5%) |
|
Executive |
(1.1%) |
(1.9%) |
(2.0%) |
|
Large Executive |
(1.6%) |
(1.0%) |
(1.7%) |
|
MPV |
(2.0%) |
(2.3%) |
(2.9%) |
|
SUV |
(1.6%) |
(2.1%) |
(2.5%) |
|
Electric |
(1.2%) |
(2.0%) |
(0.6%) |
|
Convertible |
(0.6%) |
(0.6%) |
(0.7%) |
|
Coupe Cabriolet |
(1.3%) |
(1.4%) |
(1.9%) |
|
Sports |
(1.1%) |
(1.1%) |
(1.7%) |
|
Luxury Executive |
(1.2%) |
(1.0%) |
(0.9%) |
|
Supercar |
(1.3%) |
(2.1%) |
(1.7%) |
|
Overall Avg Book Movement |
(1.6%) |
(2.1%) |
(2.5%) |
( ) Denotes negative percentages
Notable Movers 1yr 20k
GENERATION NAME
MIN £
MAX £
AVG £
AUDI A3 (12-19) DIESEL
-950
-400
-663
BMW 4 SERIES GRAN COUPE (14- ) DIESEL
150
200
180
FORD FOCUS (11-18) DIESEL
-425
-150
-276
NISSAN QASHQAI (13-18) DIESEL
-550
-350
-430
PEUGEOT 208 (12- )
-250
-125
-178
SKODA OCTAVIA (13- ) DIESEL
-400
-150
-247
VAUXHALL INSIGNIA (13-18) DIESEL
-500
-375
-437
VOLKSWAGEN GOLF (13- ) DIESEL
-400
-175
-284
VOLKSWAGEN POLO (09-18) DIESEL
175
200
188
VOLVO XC60 (08-17) DIESEL
-450
-350
-409
Notable Movers 3yr 60k
GENERATION NAME
MIN £
MAX £
AVG £
AUDI A3 (12-19) DIESEL
-600
-275
-412
BMW 1 SERIES (11-17) DIESEL
-400
-225
-284
FORD FIESTA (08-17) DIESEL
-275
-200
-236
FORD KUGA (12- ) DIESEL
-350
-150
-212
HYUNDAI I30 (12-18)
100
175
130
KIA SPORTAGE (10-16) DIESEL
-650
-375
-523
MAZDA MX-5 (15- )
150
200
175
NISSAN JUKE (10- )
-200
-125
-156
VAUXHALL INSIGNIA (13-18) DIESEL
-350
-225
-270
VOLVO V40 (12- ) DIESEL
-300
-200
-239

