
New Car Sales
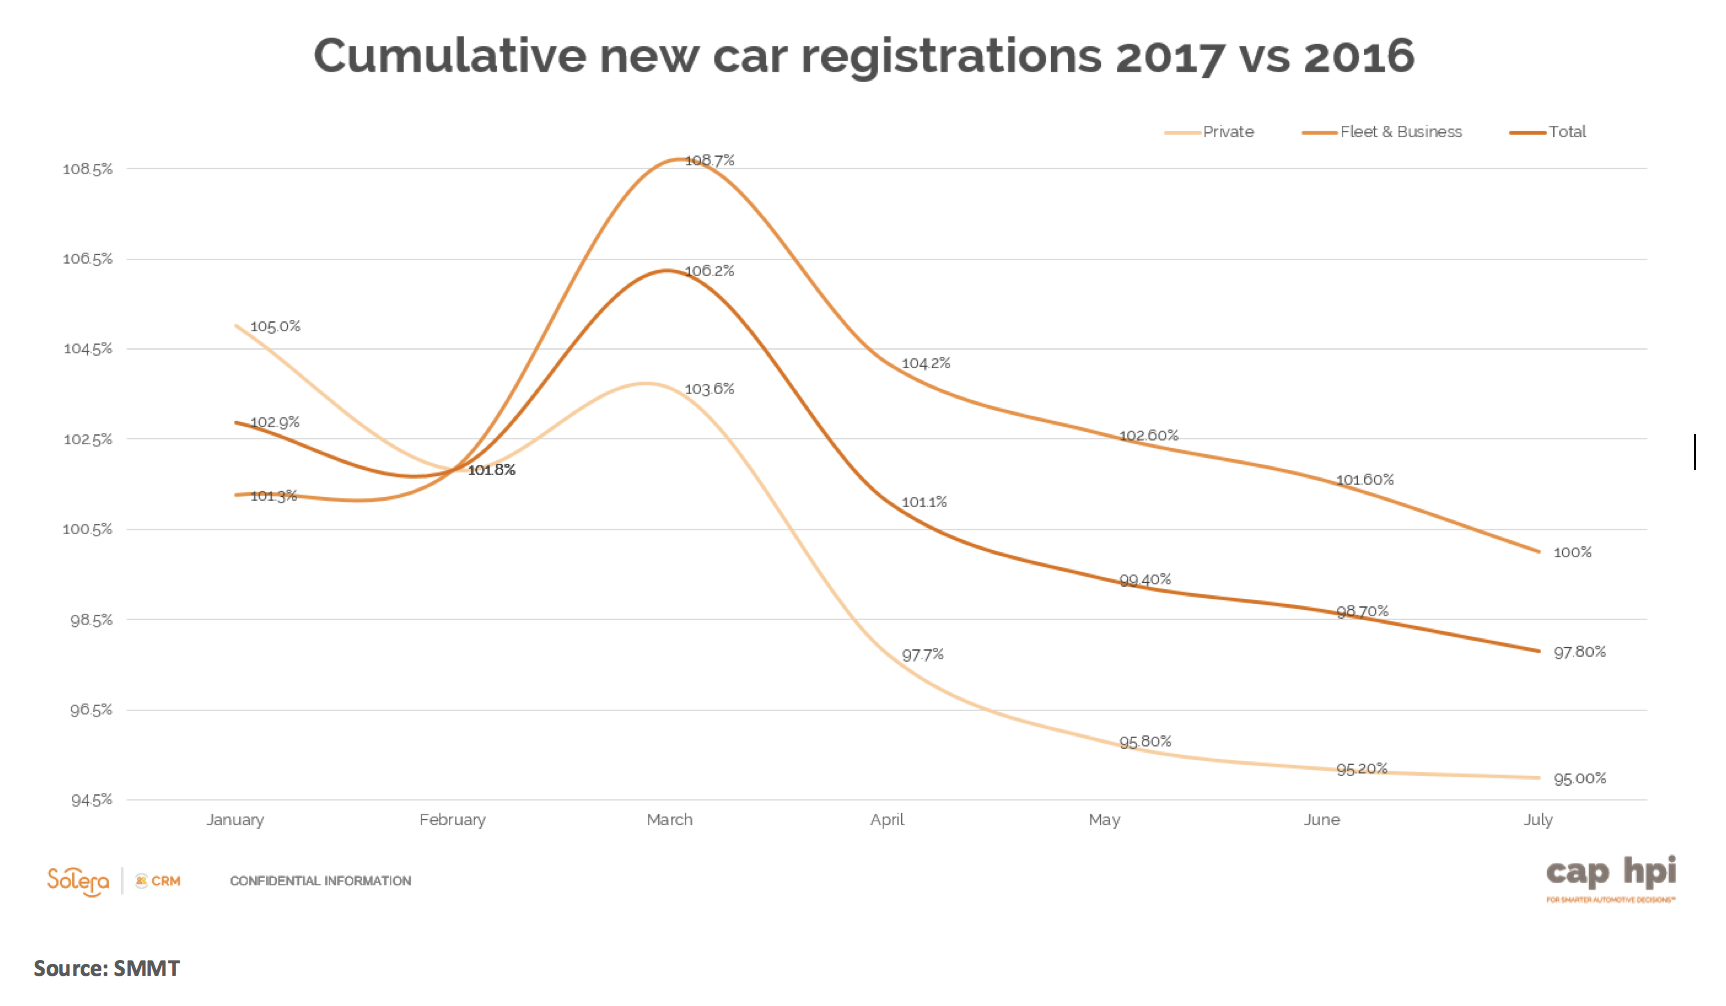
The SMMT figures for July continued to illustrate the decline in year-on-year registrations since the peak witnessed in March. This was not unexpected as most industry experts, including cap hpi, had predicted the size of the 2017 new car market would shrink from the record year of 2016. Year-to-date, overall registrations are down but only by 2.2% with a drop in private registrations of 5% and fleet and business registrations holding at the same level as last year. Whilst much of the press reporting continues to paint a negative picture, this must be put into context as, even with the SMMT prediction for a -2.6% year-on-year reduction, 2017 could still prove to be the third biggest registration year on record.
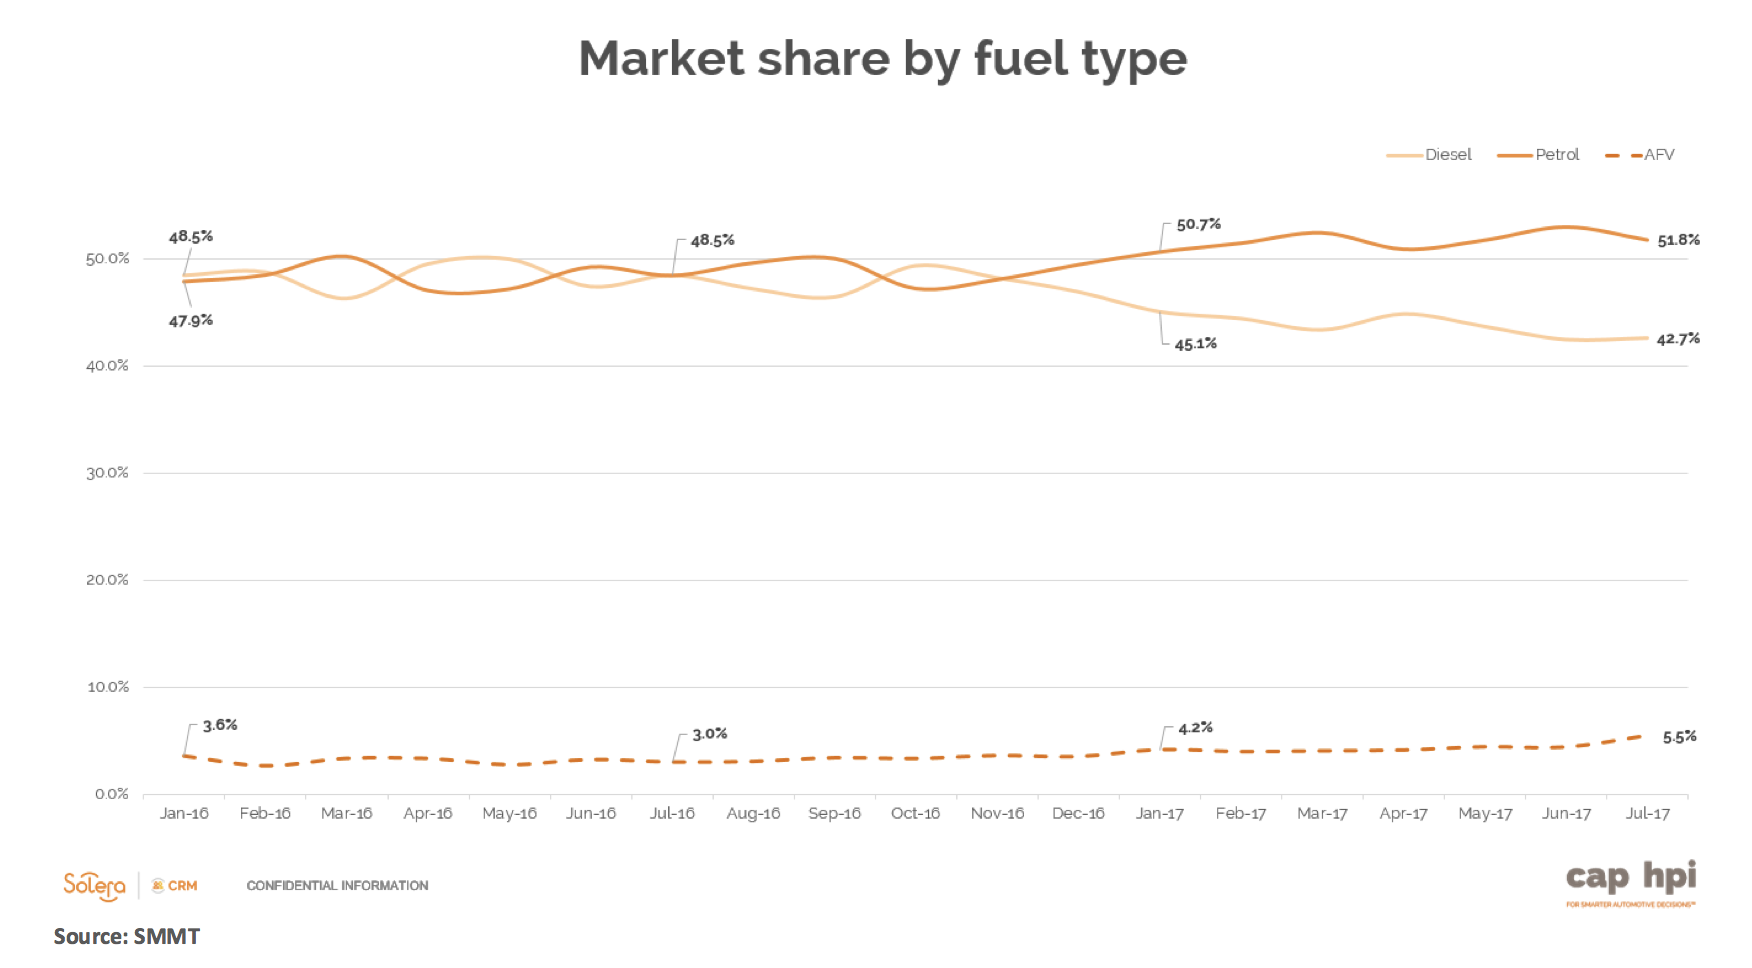
July continued to see diesel registrations soften and the graph below plots the monthly market share by fuel type since January 2016. As the graph illustrates, both diesel and petrol tended to follow a similar pattern through 2016 but there is a noticeable drop off in diesel market share from December onwards and the year to date market share of 43.6% is down by 4.4% against 2016. It is clear that buyer behaviour has changed, as the press reports have painted diesel in such a negative light, and this trend looks set to continue going forwards. Alternative Fuel Vehicles have seen volumes rise as new petrol hybrid models enter the market and the market share in July grew to a high of 5.5% for the month and sits at 4.3% year-to-date. However, it appears that the most significant move is towards petrol models as people look to find an alternative to diesel with a year-to-date market share of 52% in contrast to 48.8% at the same point last year.
Used Cars – Retail
The original SMMT release suggesting that the used car market was down by 13.5% did seem to be at odds with the surveys and feedback that we had received from the industry. News that there had been an issue with an algorithm and the market in Q2 was only 0.7% down was far more reflective of both the used car values that we had seen in that period and also the sentiment of the dealers. As we moved firmly into the holiday season, the levels of footfall and enquiry rate were likely to drop off in comparison to the previous month and the dealer survey certainly confirmed this.
Of those surveyed, only 13% had felt an increase in physical footfall with 63% stating that footfall had declined in August when compared to July. The remaining 24% felt that levels had been on par with the previous month. On-line activity appeared to be slightly stronger with only just over a third of dealers reporting a drop off and the remainder suggesting that enquiry rates had remained at a consistent level with the previous month.
Margins continue to come under pressure and over 60% of those who responded stated that they felt profitability remained under pressure. Only 13% had felt an improvement with the remainder experiencing similar margins to July.
Overall, half of those surveyed felt that Retail demand had been worse than the previous year, just over a third stated that it was at similar levels and only a small proportion of the remaining dealers had seen an improvement.
Auction Activity
August tends to see an easing of stock within the wholesale market and this year was no exception. The easing of stock had caused prices to hold well and, in general terms, conversion rates to remain relatively stable throughout the month. Franchised dealer attendance was strong as they appeared to have appetite for stock which follows the view that their focus appears to have switched from the shrinking new car arena to used cars.
Throughout most of this year, the prevalence of “cap clean” vehicles within the wholesale market had led to weaker performances on vehicles that required a little more preparation in order to bring them up to retail standard. The relative reduction in available stock through August saw dealers beginning to bid on and buy some of the medium grade cars in order to satisfy forecourt requirements. However, poor and excessive mileage examples continued to prove unappealing to most buyers.
Used Cars – Trade Values
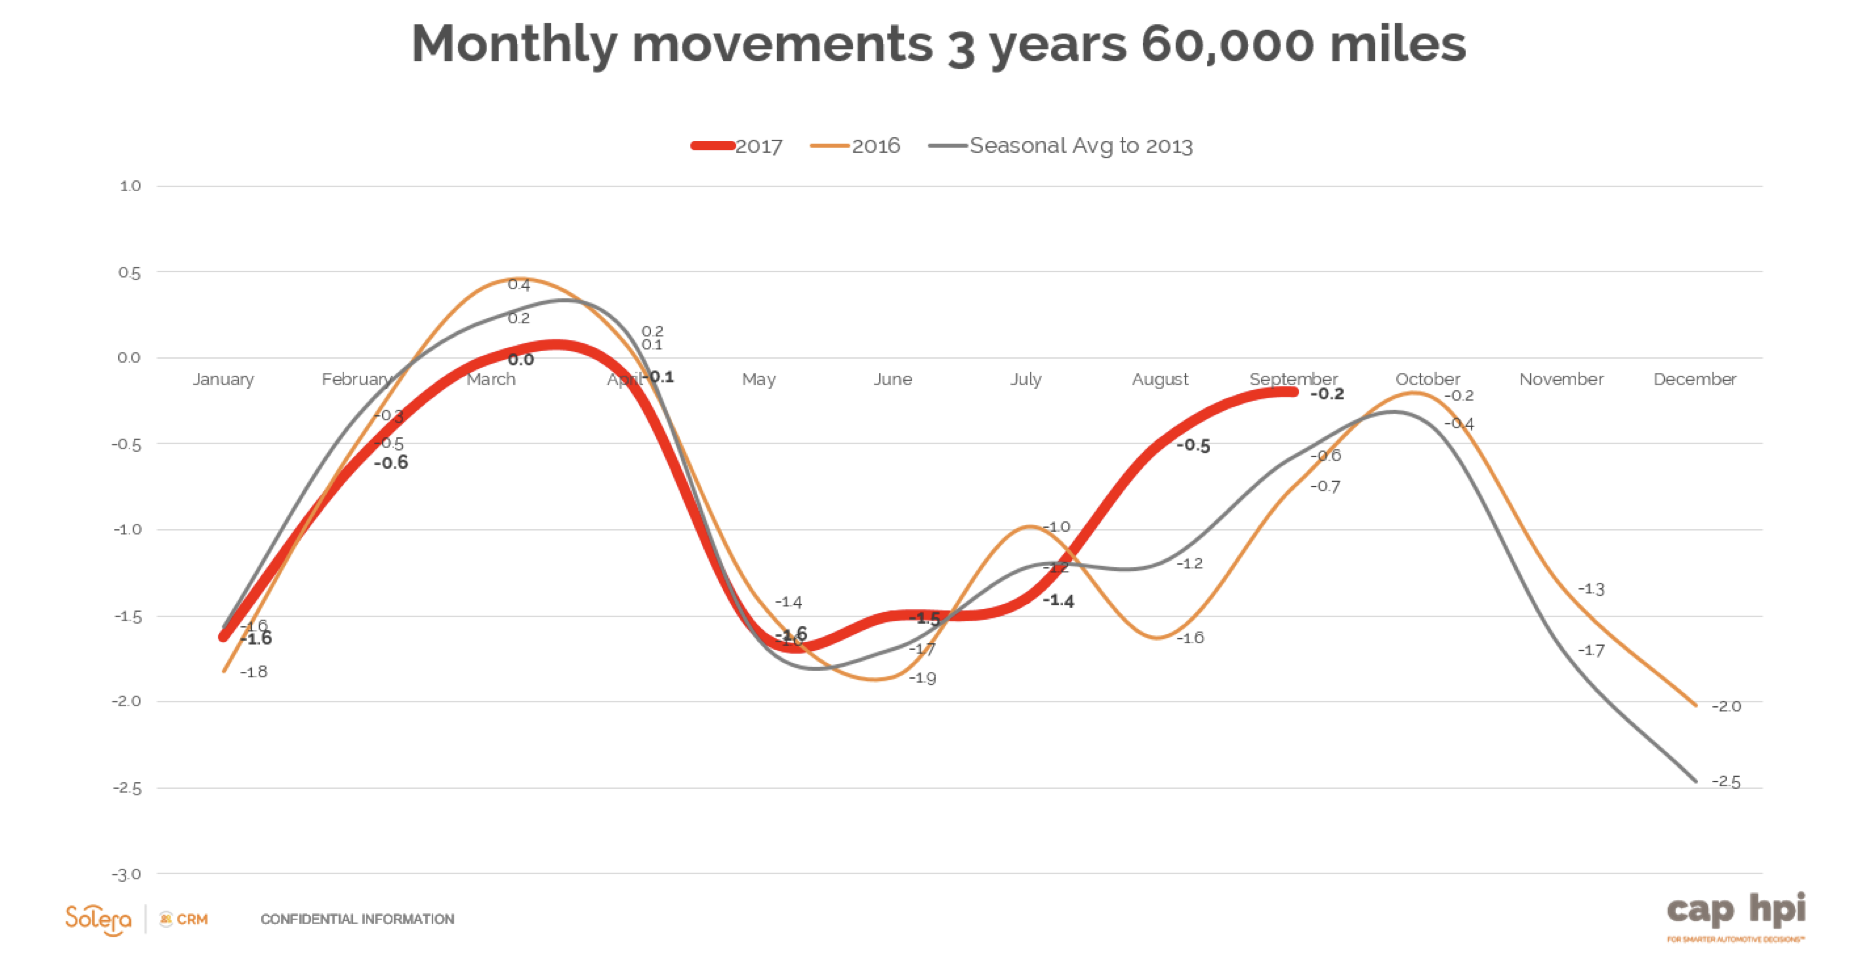
August, in general, saw stable trade values reflecting the lower stock levels held within the marketplace. Overall, at 3 years 60,000 miles the average downward movement was only 0.2%. As the graph below indicates, 2016 had seen a reduction of 0.7% and the average movement since 2013 has been -0.6%. The stability of the market witnessed through July certainly continued and it was evident that the balance of supply versus demand fell even more in favour of sellers throughout the month.
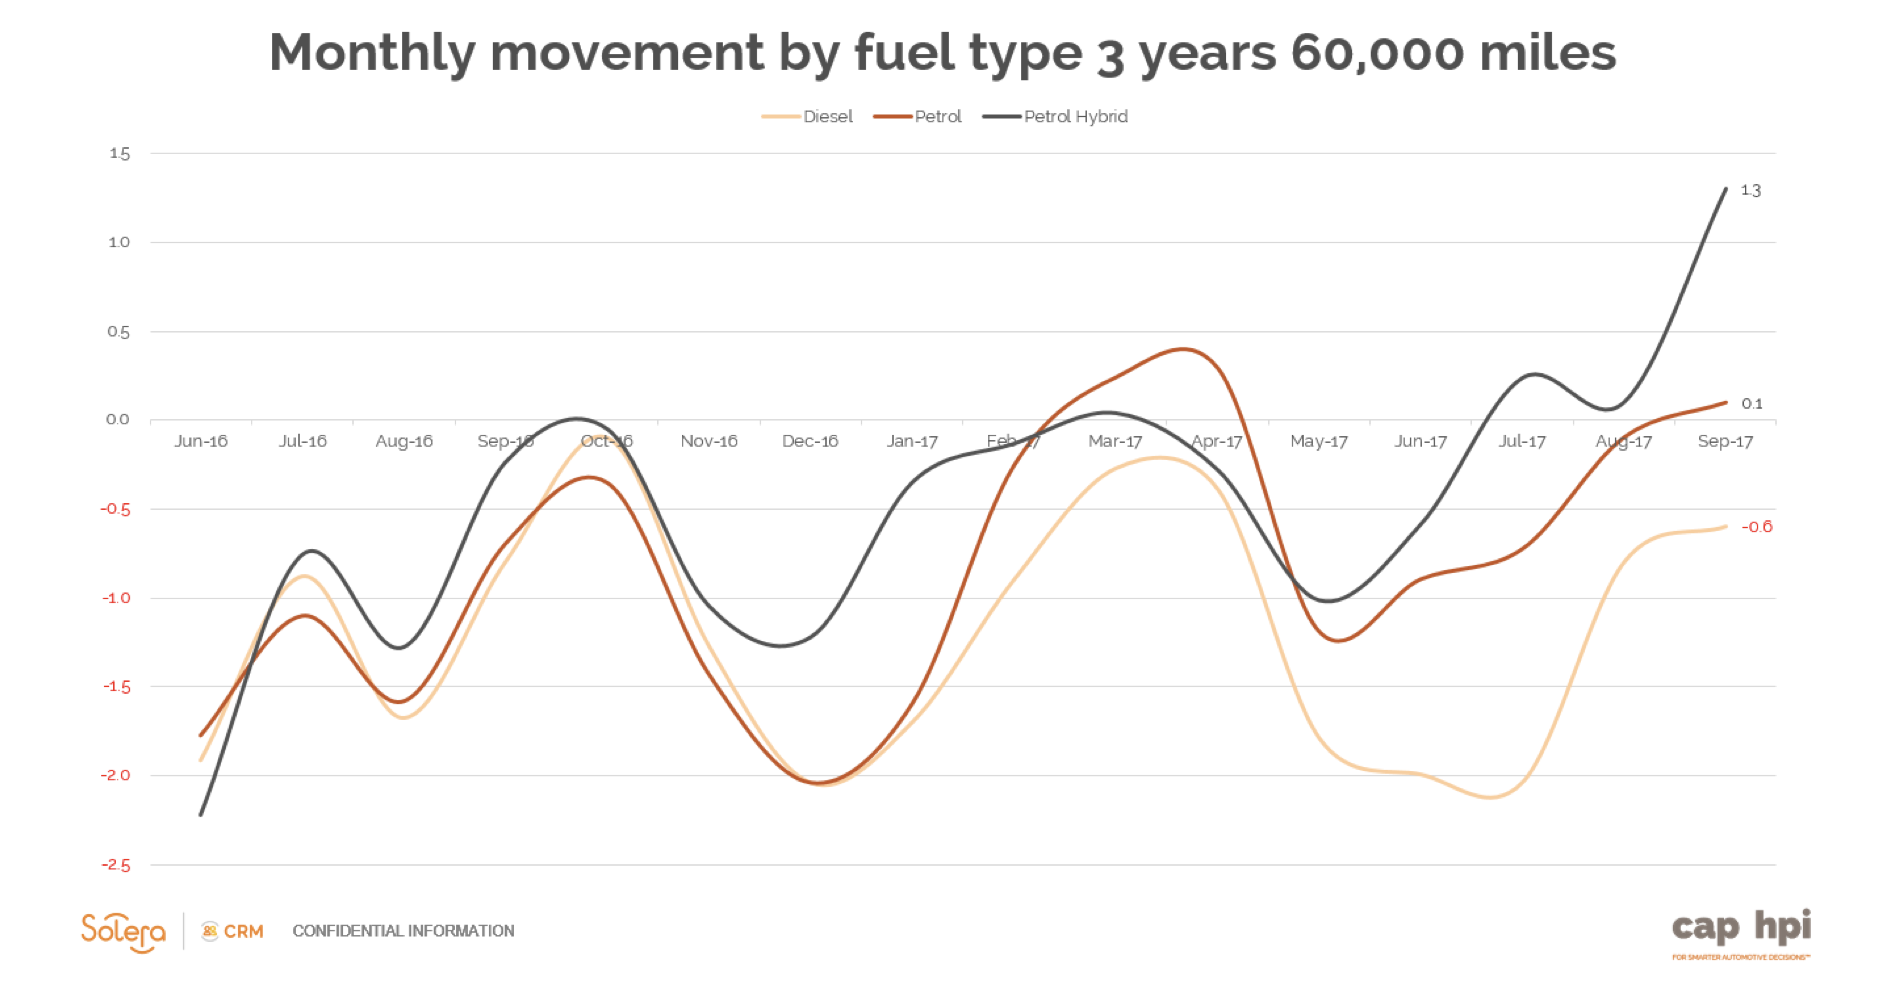
Movements by fuel type, as pictured below, give a good indication of what had driven the strength into the market. Whilst the average diesel movement at 3 years 60,000 miles was a downward one of 0.6% this was a slightly stronger performance than witnessed at the same point last year where diesel prices had eroded by 0.8%. The key factor leading to the average stability during August was the performance of both petrol and petrol hybrid fuel types. As mentioned in the New Car Sales section above, the impact of the press stories relating to diesel has led to increased strength elsewhere. Petrol, on average, saw an increase in values of 0.1% which is far stronger that the -0.7% movement witnessed at the same point in 2016 with automatic gearbox derivatives proving popular. As highlighted in last month’s editorial, Petrol Hybrid movements again saw significant strength and saw average prices move up by 1.3%. Electric Vehicles also saw signs of stability with prices only edging back by 0.1% through the month – much of this being driven by vehicles fitted with range extenders.
When interrogating the performance by sector, a number of interesting observations can be made. City Car saw great strength at 3 years 60,000 miles and witnessed an increase in values of 1.3%. Some of the standout performances within the sector were Skoda Citygo (12- ) and Hyundai I10 (14- ) which both saw increases of 3.0%, Toyota iQ (09-15) which saw a rise of 2.9% and Peugeot 108 (14- ) which increased by 2.1%. This sector is dominated by petrol derivatives and the lower volumes of nearly new vehicles witnessed this year have been a significant factor in their performance.
The Lower Medium sector also saw strength at the 3 years 60,000 miles mark and saw average values improve by 0.4%. Whilst certain derivatives did see prices erode, strength was observed with a number of models performing particularly well. Toyota Auris (12- ) Hybrid increased by 5.4%, Volkswagen Golf (09-14) Diesel found traction and improved by 4.9% and the Hyundai I30 (12- ) saw average prices rise by 3.3%. Whilst diesel has come under pressure overall, the performance of the Golf is a reminder that there are still a number of customers that are still willing to move into a diesel.
Supermini also performed above the average movement with an increase of 0.2%. Again, much like City Car, this sector is more heavily weighted towards petrol and the key performers at 3 years 60,000 miles were Dacia Sandero (13- ) which moved up by 3.1%, Toyota Yaris 12-17) Hybrid and the Hyundai I20 (14- ) which both saw average values increase by 3.0%.
Convertible derivatives saw values fall at a greater than average rate as we begin to head towards the latter stages of the year, moving back by 1.3% at 3 years 60,000 miles. One standout model was the Fiat 500C (09- ) which appeared to be in demand and saw values improve by 2.0%.
Whilst the 3 year 60,000 miles mark remained relatively stable, it is notable that the 10 year 100,000 miles mark felt more significant pressure with values deteriorating by 1.3
Full sector performances are detailed in the table below.
What Next?
Since 2013, the average monthly book movement at 3 years 60,000 miles from September to October has been slight easing of 0.4% which tends to reflect the relatively lower volumes of wholesale stock in the market. There is no reason to expect the movement this year to be markedly different unless we see a critical event take place that upsets consumer confidence. It will be interesting to observe the potential volume push into the September new car market as manufacturers look to cement their volume strategies for the year. Whilst certain franchises have reported an easing in their Q3 sales objectives, it is clear that many more still have significant volume expectations. The consumer offers have been enhanced in the run up to the plate change and there is a real focus on scrappage offers to pull consumers into the showrooms. The timing of these marketing messages appears to fit well with the press demonization of diesel and the change in customer behaviour. Should this strong retail proposition work, we could see far less forced registration activity and should also see some of the more polluting vehicles removed from the road.
Our dealer survey asked retailers where they expected the new car market to be in September. Interestingly, none of the respondents expected it to increase with a third suggesting that it would be on par and the remaining two thirds expected to see a contracting market. Should this prove to materialise, it could have the potential of removing the potential volatility of significant pre-registration and the ensuing downward compression on used values.
A close eye must be kept on how the market tends to behave in the latter months of the year. Historically, post plate-change, and certainly towards the very end of September, the wholesale market begins to see stock volumes increase dramatically and whilst we tend to see reasonable levels of stability through the first half of September the increased de-fleet activity will mean that the market can change quickly. For our cap live customers, we will continue to provide daily feedback on values driven by significant data volumes interpreted by our expert editorial team.
black book September 17 - Average Value Movements (Plate Uplift Excluded)
|
|
1 yr/10k |
3 yr/60k |
5 yr/80k |
|
City Car |
1.4% |
1.3% |
1.4% |
|
Supermini |
(0.2%) |
0.2% |
0.2% |
|
Lower Medium |
(0.3%) |
0.4% |
0.2% |
|
Upper Medium |
(0.6%) |
(0.7%) |
(0.9%) |
|
Executive |
(0.2%) |
(0.4%) |
(0.4%) |
|
Large Executive |
(1.3%) |
(1.2%) |
(1.1%) |
|
MPV |
0.2% |
(0.2%) |
(0.7%) |
|
SUV |
(0.5%) |
(0.6%) |
(0.7%) |
|
Electric |
0.6% |
(0.0%) |
(2.0%) |
|
Convertible |
(0.8%) |
(1.3%) |
(1.3%) |
|
Coupe Cabriolet |
0.0% |
(0.3%) |
(1.1%) |
|
Sports |
(0.2%) |
0.0% |
0.0% |
|
Luxury Executive |
(0.9%) |
(0.9%) |
(0.4%) |
|
Supercar |
0.0% |
0.0% |
0.0% |
|
Average Movement |
(0.3%) |
(0.2%) |
(0.4%) |
( ) Denotes negative percentages
Notable Movers 3yr 60k
Generation Name
Min £
Max £
Avg £
AUDI A6 (11- ) DIESEL
-450
-200
-317
BMW 3 SERIES (12- ) DIESEL
-200
-75
-125
BMW I3 (13- )
250
300
268
BMW X6 (08-14) DIESEL
-1,050
-800
-857
HONDA CR-V (12- ) DIESEL
-450
-275
-350
HYUNDAI I10 (14- )
100
125
115
JAGUAR F-TYPE CONVERTIBLE (13- )
-1,400
-500
-833
JAGUAR XF (11-15) DIESEL
-600
-350
-442
LAND ROVER RANGE ROVER (13- ) DIESEL
-1,300
-400
-733
LAND ROVER RANGE ROVER SPORT (13- ) DIESEL
-700
-300
-575
MERC C CLASS (11-14) DIESEL
-200
-100
-120
PORSCHE PANAMERA (11-15) DIESEL
-1,200
-1,200
-1,200
SKODA OCTAVIA (13- ) DIESEL
-225
-50
-130
TOYOTA AURIS (12- ) HYBRID
325
650
514
TOYOTA LAND CRUISER (09- ) DIESEL
650
1,100
900
VAUXHALL ZAFIRA (05-15)
150
175
163
VOLKSWAGEN GOLF (09-14) DIESEL
250
275
270
VOLKSWAGEN POLO (09- )
75
175
111
VOLKSWAGEN TOUAREG (10- ) DIESEL
-900
-150
-508
VOLVO V40 (12- )
225
350
275

