
New Car Sales
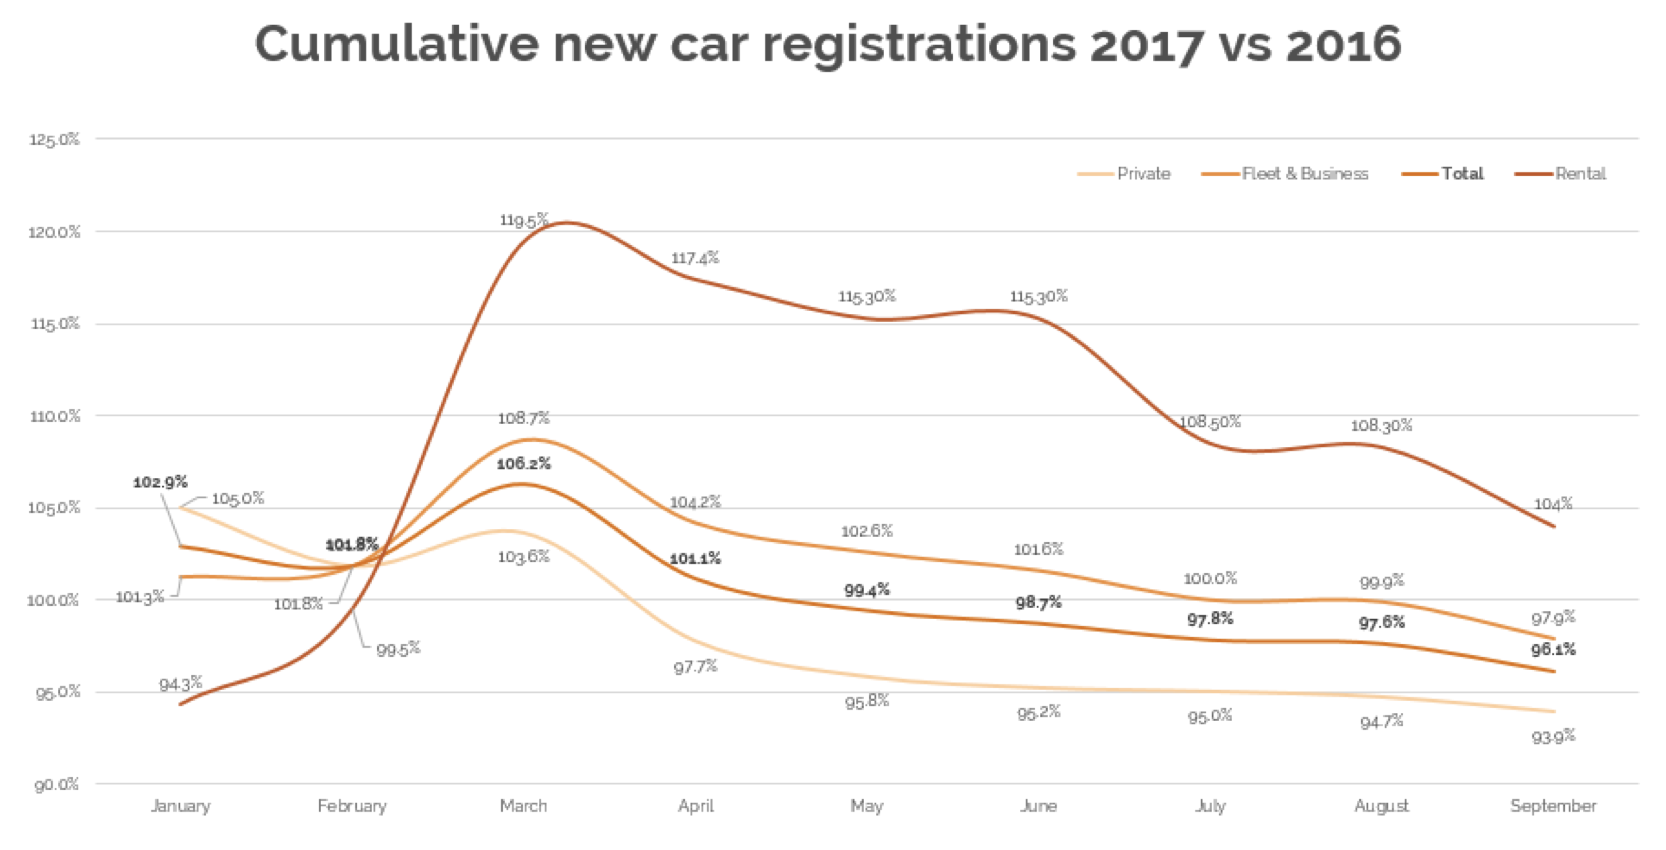
September statistics released by the SMMT illustrated a number of important factors affecting the new car market in what is seen as the second most significant registration month of the year. The headline of a 9.3% reduction against the same month of 2016 will, no doubt, have drawn attention although the trend of declining new car sales should not come as a great surprise. The chart below illustrates the continual decline in registration activity since March and, year-to-date, sees private registrations down by 6.1% against last year. This was despite some strong marketing campaigns from a number of manufacturers offering significant savings for scrapping older vehicles. The growth witnessed in 2016 was mainly driven by strength in Fleet and Business registrations – so far this year this has contracted by 3.9% and saw a 9.68% reduction when compared to September 2016.
The spike in rental registrations observed in March has dissipated although, year-to-date, still sits at 104%. As manufacturers look to achieve volume expectations for 2017, and with private registrations seemingly somewhat of a challenge, it will be interesting to see how much rental registration activity takes place in the final quarter of the year.
Source: SMMT
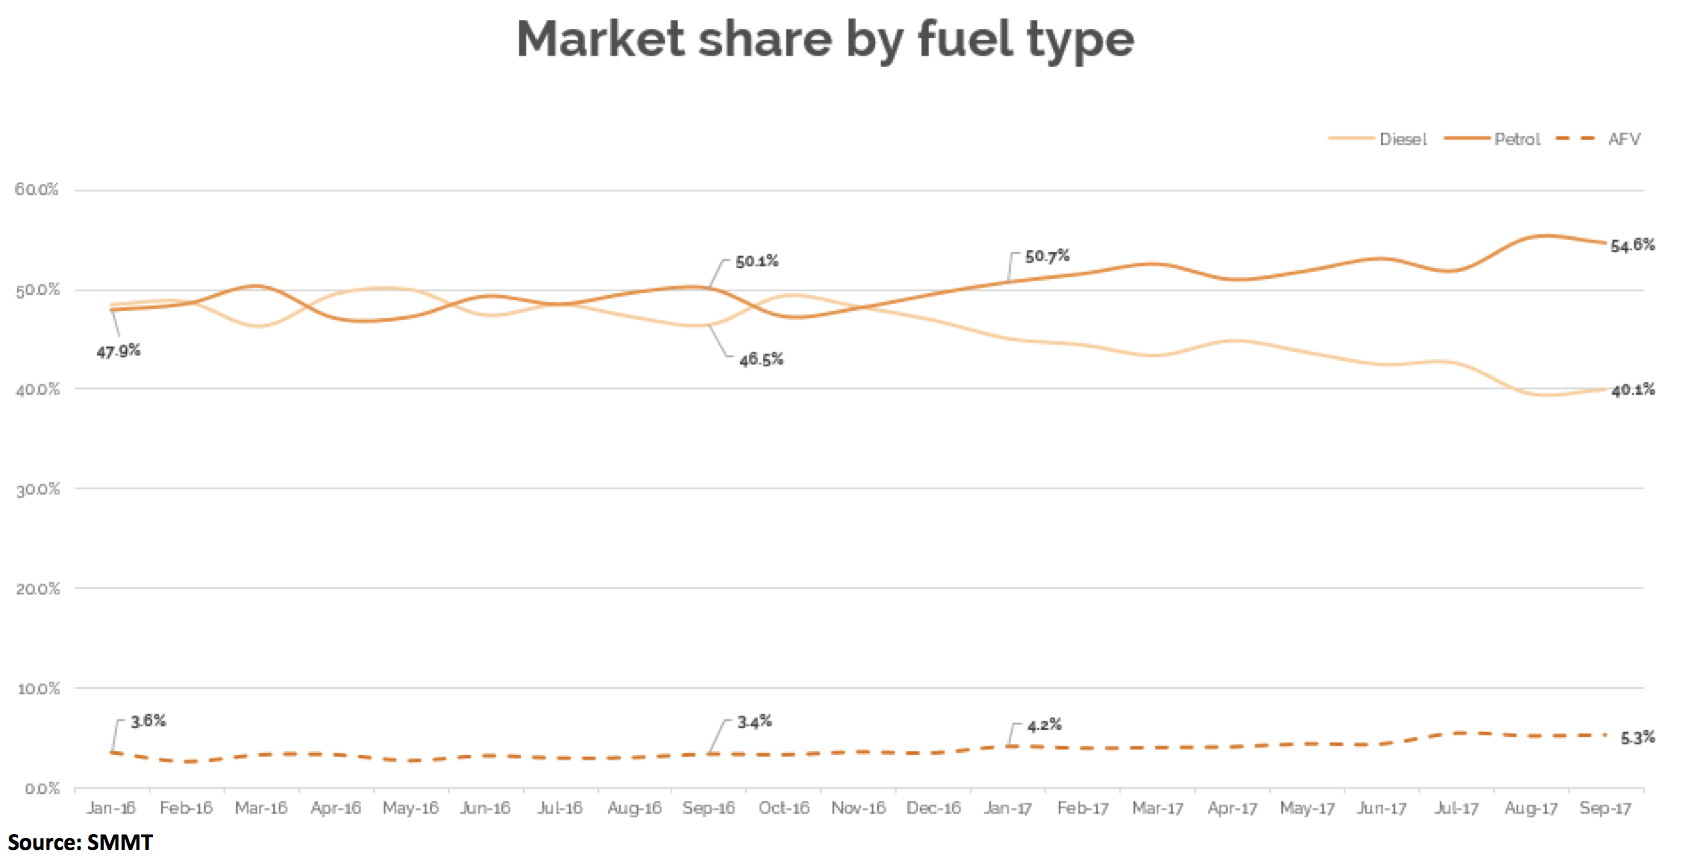
The trend of new car consumer behaviour moving away from diesel was once again evident, as the chart below highlights, with its market share sitting at a modest 40.1% in September and at 42.8% year-to-date. One of the contributory factors to the lower overall September volume has been the lack of petrol stock available as the consumer switch to diesel has not been matched with the change in new car manufacturing, leading to a shortfall.
Alternative Fuel Vehicles saw market share above 5% once more, although volumes of pure electric vehicles actually sat below levels experienced in September 2016. Petrol Hybrid vehicles continue to dominate the AFV market and we see increasing numbers of manufacturers releasing new models to market as company car drivers, in particular, look to take advantage of the low Benefit In Kind rates on offer.
The SMMT projection of a 2.6% slip in the new car market looks to be a little stronger than we may actually experience this year as it already sits at -3.9% and, barring extraordinary activity in the final quarter, the closing months of 2017 are unlikely to see additional volume over 2016.
All of this being said, it is continually important to note that the year will still end with a significant volume of new vehicles having been registered and is likely to rank as the third highest on record.
Auction Activity
The very beginning of October appeared to be showing signs of the tail-end of what had been a period of buoyancy in the used car market, as attendance and conversion rates remained relatively high. Good quality, desirable stock found traction and prices were generally steady. This was, however, short lived as wholesale stock began to grow at a time when the volume of buyers, particularly from franchised dealers, dissipated significantly. The market usually sees a softening through this period of the year as the perfect storm of slowing retail demand and greater stock availability builds. Vendors that reacted to the changing market and understood that expectations on day one of the month were far removed from what could be achieved as each day passed, managed to achieve reasonable conversion rates. Those that held out for values achieved on day one found conversions difficult and are likely to have to re-enter stock into an ever weakening market. There are certain times of the year to pay incredibly close attention to what the buyers are telling you – this is most definitely one of them as we move into the most volatile time of the year.
Used Cars – Trade Values
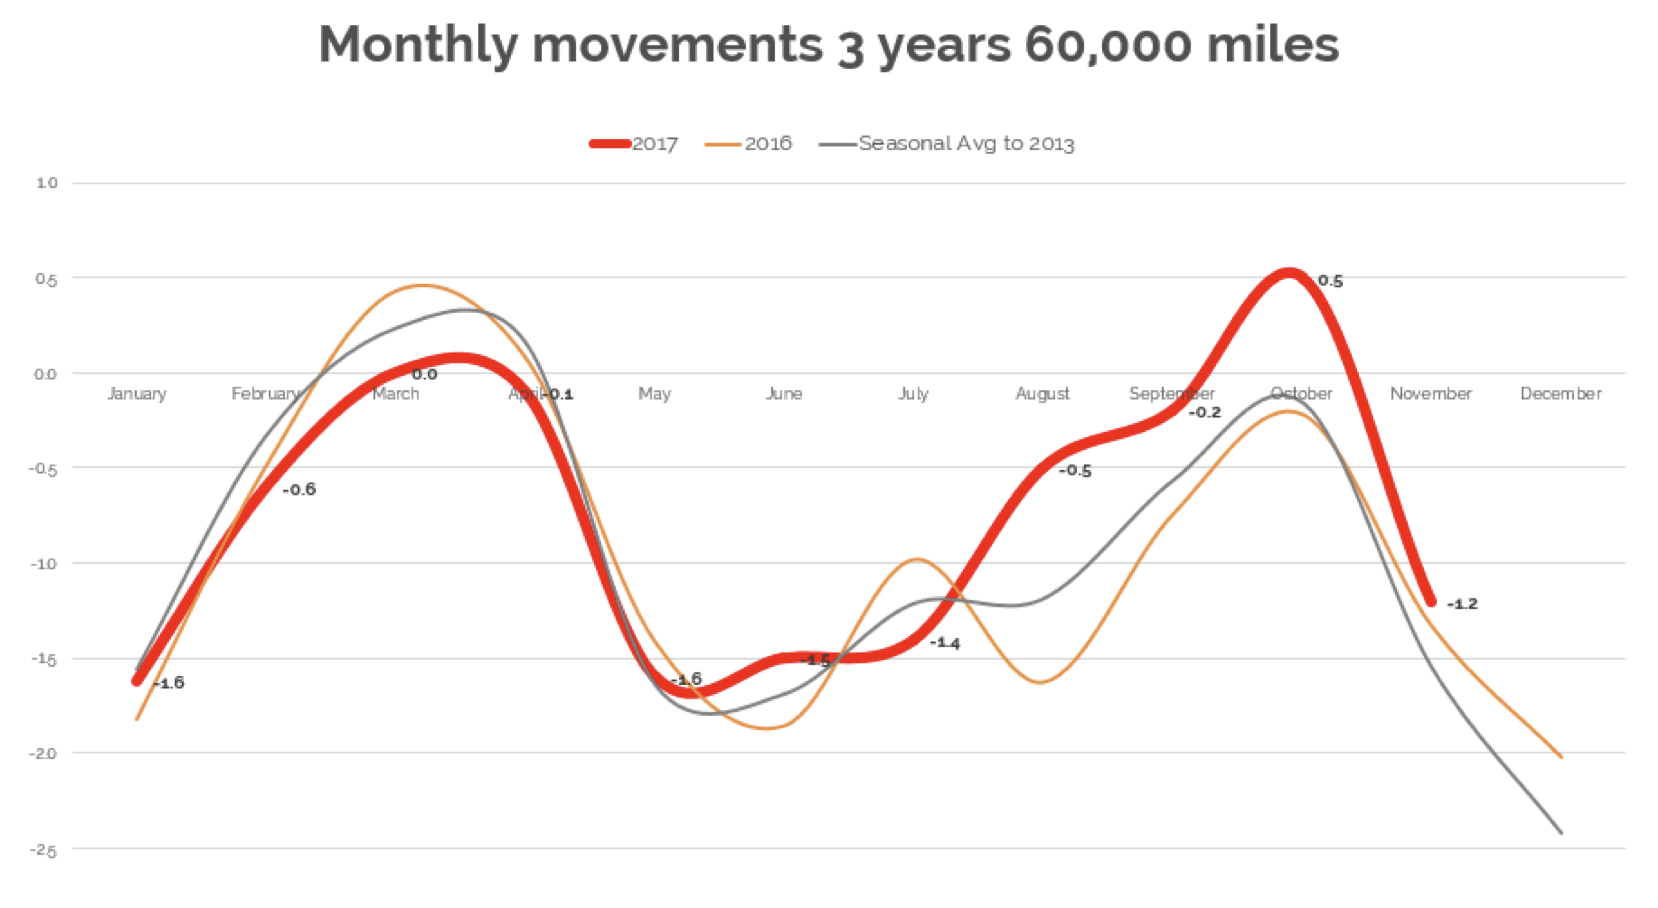
The second half of October saw significant signs of a weakening market and accounted for the greatest proportion of the 1.2% decline in values at 3 years 60,000 miles. In comparison to 2016, and the average observed since 2013, this was slightly less of a reduction than we have previously seen, however, it has signalled the steeper drop in values that would normally be expected moving into November. The later we moved into October, the steeper the decline in values as our subscribers to cap live witnessed.
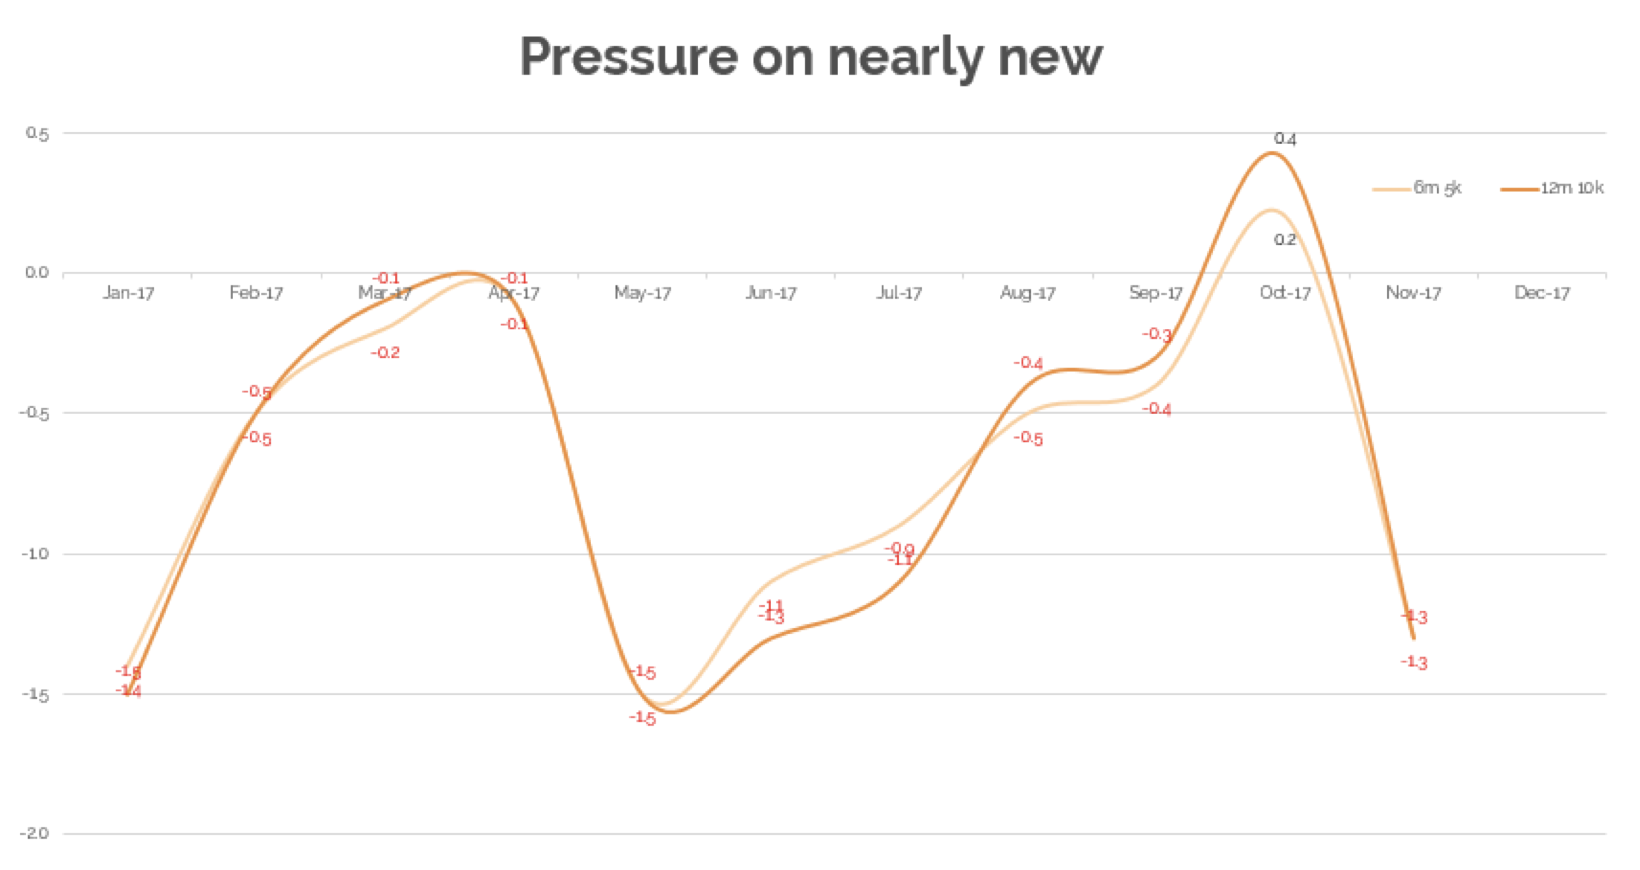
Nearly new values at 6 months 5,000 miles and 1 year 10,000 miles felt slightly greater pressure and moved back by 1.3%. Much of this was linked to the greater volume of short-term rental vehicles appearing in the market after the high registration levels witnessed in the first quarter of the year, alongside the negative effect of tactical registration activity that took place at the end of September. The level of pre-registered vehicles appears to be growing each day and there are in excess of 12,000 67 plate vehicles on offer, much of which are identical models that are likely to see price erosion as a result.
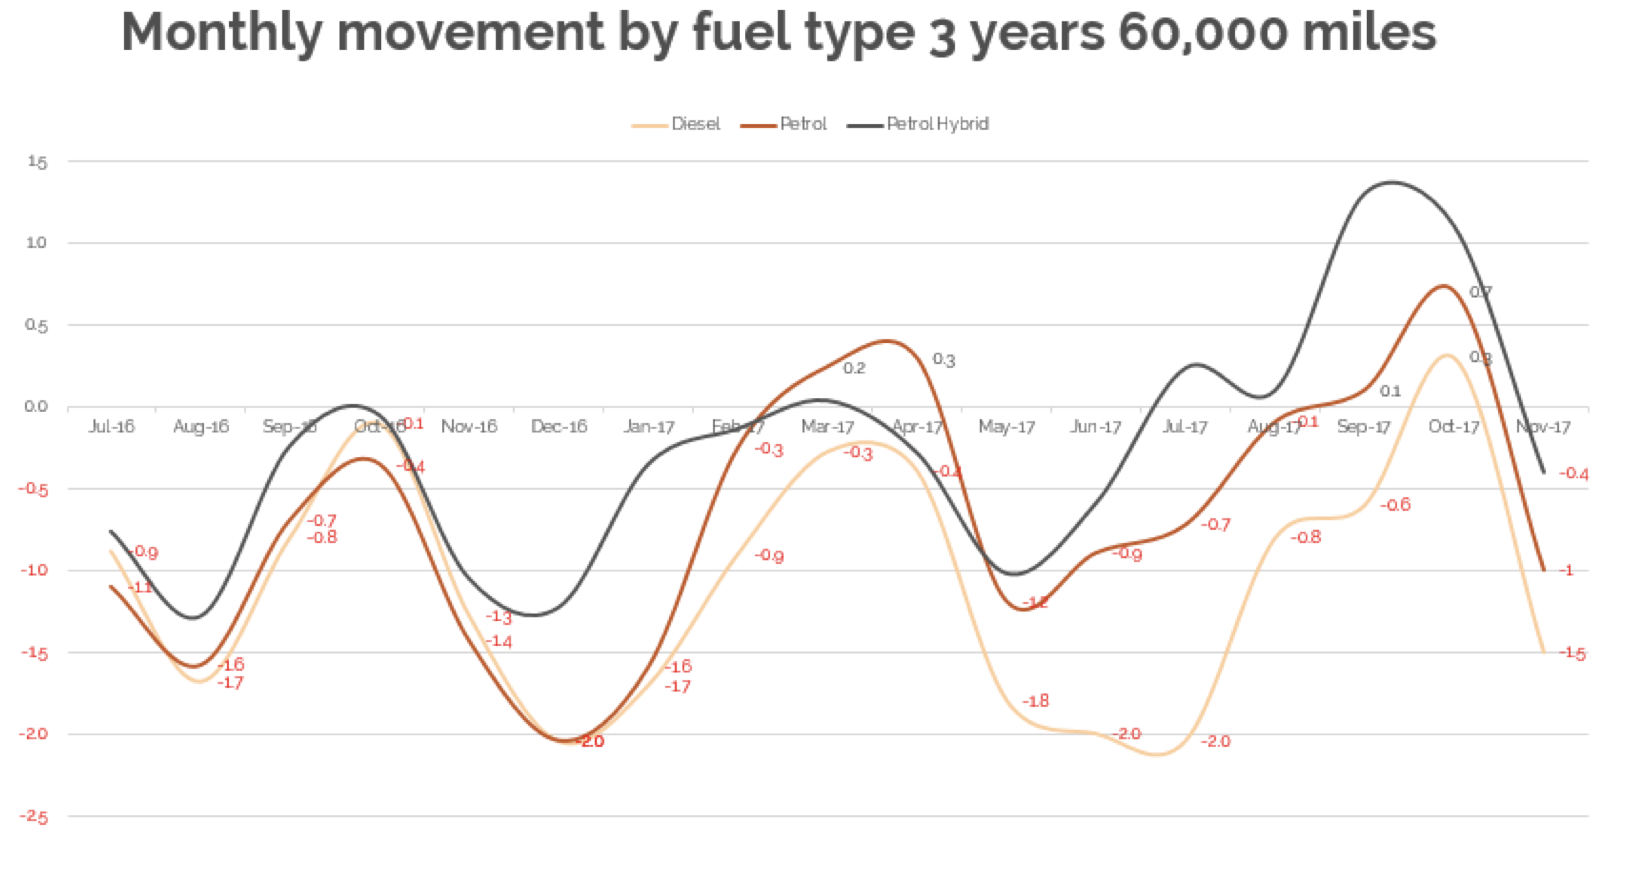
Movements by fuel type at 3 years 60,000 miles showed diesel car prices slide by an average of 1.5%, petrol variants by 1% and petrol hybrids by 0.4%. All saw a dip reflecting the general market conditions, the larger reduction witnessed on diesel reflected the increase of fleet and leasing returns that have, historically, seen greater proportions of diesel product.
Pure electric vehicles stood out through October and saw values increase, at 3 years 60,000 miles, by 0.3%. Whilst this is a sector that does not contain a significant number of derivatives, there were a number of vehicles that experienced particular strength throughout the month. Renault Zoe (13- ) Electric rose by 4.9%, Nissan Leaf (10- ) increased by 3.8%, and the Citroen C-Zero (11- ) improved by 2.8%.
Analysing performance by sector at 3 years 60,000 miles, City Car stood out as one of the more stable sectors and witnessed a decrease in values of only 0.1%. A number of models held their value but the key strength was observed in the Skoda Citigo (12- ) which moved up by 3%, Toyota Aygo (09-14) which increased by 2.1% and the Volkswagen Up (12- ) which saw prices rise by 2.0%.
The Lower Medium sector saw greater than average price reductions as higher volume appeared in the wholesale market and overall values declined by 1.5% at 3 years 60,000 miles. Citroen DS4 (11-15) Diesel saw a decline of 5.1%, Volvo V40 (12- ) moved back by 3.6% and the Peugeot 308 (13- ) Diesel saw a reduction of 3.2%.
The proportion of SUV data, both in the wholesale and retail market, has steadily grown throughout the year. Seasonally, the SUV sector tends to remain reasonably strong at this time of year but saw average movements at 3 years 60,000 miles soften by 1.2%. In contrast to the overall average, nearly new vehicles held their value slightly better only seeing a decline of 1%. Whilst volumes continue to grow it is interesting to see that appetite for this sector remains strong.
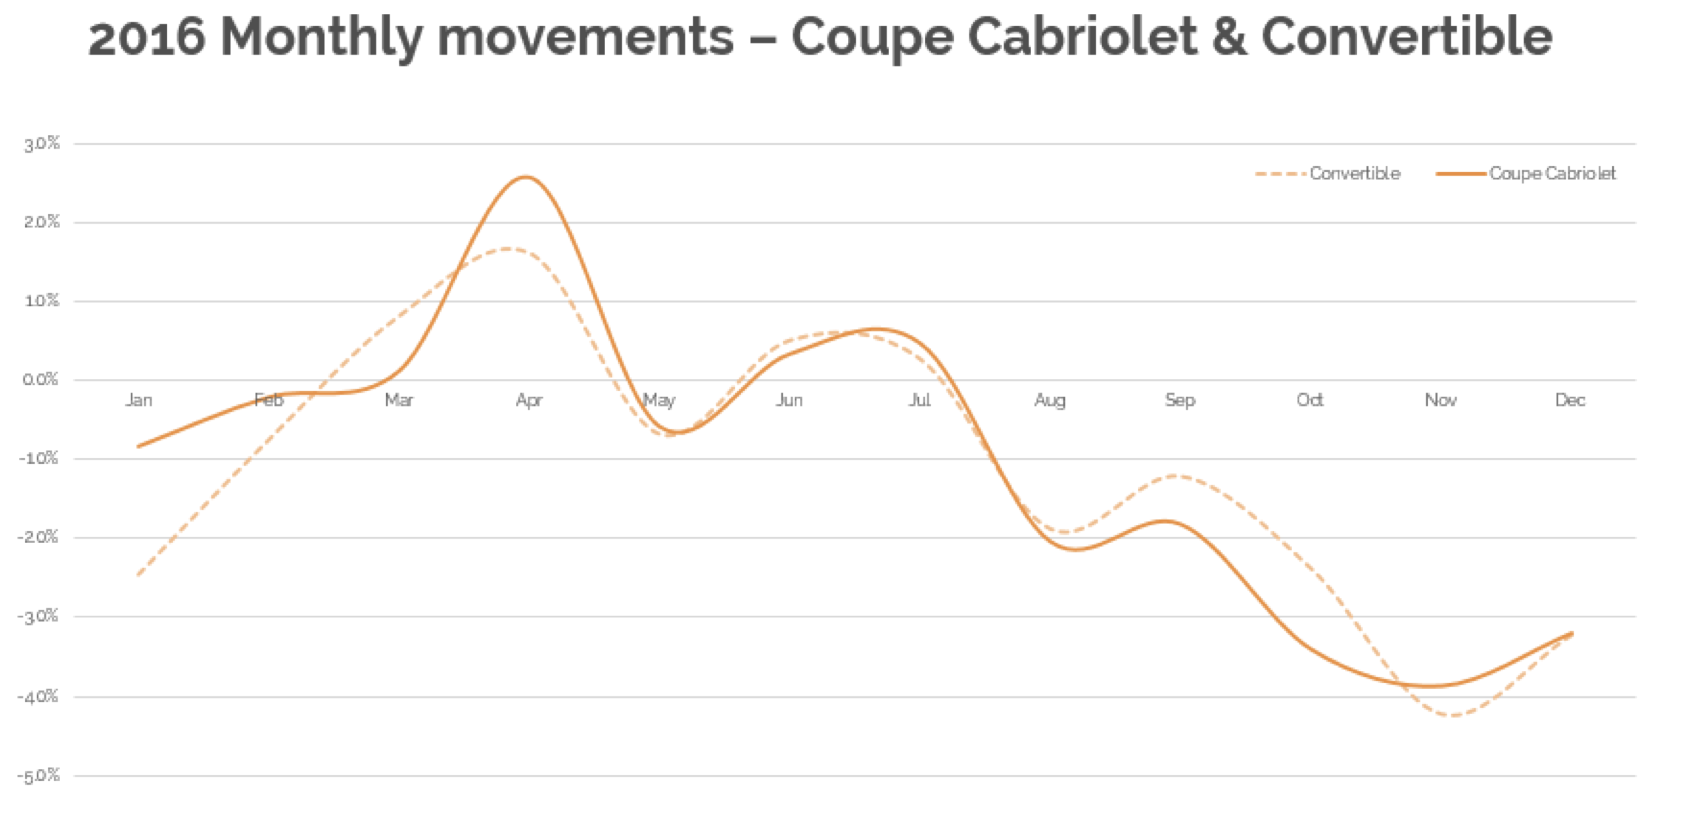
The steepest decline in values were to be found in the Coupe Cabriolet and Convertible sectors which saw reductions of 4.4% and 3.5% respectively. The graph below illustrates the monthly movements experienced in 2016 for these sectors and it is evident that these are particularly seasonal. November and December tend to see the beginning of the recovery as buyers, seeing that values have fallen to their lowest in the year, begin to look at purchasing in preparation for spring which historically sees values recover dramatically.
What Next?
There is no doubt that the market is slipping back at its fastest rate this year and the likelihood is that we will continue to see prices erode through November and December. Stock purchase decisions will need to take into account how quickly the market moves and cap live will continue to report on the ever changing values. A number of groups will be looking to build their stock, at a time that could be perceived as a buyers’ market, in preparation for the surge in retail activity in January and there are likely to be a number of manufacturers and remarketing companies that will be looking to reduce their inventory for year end. For those with capacity to buy, there may well be deals to be had. For those that are looking to sell, holding out too strong for too long could prove to be costly as we see the market move on a daily basis.
black book November 17 - Average Value Movements
|
|
1 yr/10k |
3 yr/60k |
5 yr/80k |
|
City Car |
(0.3%) |
(0.1%) |
0.6% |
|
Supermini |
(0.8%) |
(0.7%) |
(0.7%) |
|
Lower Medium |
(1.9%) |
(1.5%) |
(1.2%) |
|
Upper Medium |
(1.3%) |
(1.2%) |
(1.3%) |
|
Executive |
(1.7%) |
(1.1%) |
(0.6%) |
|
Large Executive |
(1.7%) |
(1.9%) |
(1.6%) |
|
MPV |
(0.5%) |
(0.6%) |
(0.7%) |
|
SUV |
(1.0%) |
(1.2%) |
(1.1%) |
|
Electric |
0.1% |
0.3% |
1.6% |
|
Convertible |
(2.8%) |
(3.5%) |
(3.9%) |
|
Coupe Cabriolet |
(3.7%) |
(4.4%) |
(5.1%) |
|
Sports |
(1.6%) |
(1.0%) |
(0.7%) |
|
Luxury Executive |
(0.3%) |
(0.4%) |
(0.3%) |
|
Supercar |
(1.5%) |
(1.5%) |
(1.1%) |
|
Average Movement |
(1.3%) |
(1.2%) |
(1.2%) |
( ) Denotes negative percentages
Notable Movers 3yr 60k
Generation Name
Min £
Max £
Avg £
AUDI A3 (12- ) DIESEL
-400
-100
-231
AUDI A4 (12-15) DIESEL
-150
-75
-125
BMW 1 SERIES (11- ) DIESEL
-350
-150
-245
BMW 3 SERIES (12- ) DIESEL
-450
-175
-256
BMW 5 SERIES (13-17) DIESEL
-200
-100
-152
FORD FOCUS (11- ) DIESEL
-100
-50
-66
FORD GALAXY (10-15) DIESEL
150
350
239
KIA SPORTAGE (10-16) DIESEL
-200
-125
-165
LAND ROVER RANGE ROVER EVOQUE (11- ) DIESEL
-600
-200
-375
MERC A CLASS (12- ) DIESEL
-300
-200
-248
MERC C CLASS (11-14) DIESEL
-300
-200
-242
NISSAN JUKE (10- ) DIESEL
-100
-100
-100
NISSAN LEAF (10- )
200
275
237
NISSAN QASHQAI (13- ) DIESEL
-200
-125
-150
SKODA OCTAVIA (13- ) DIESEL
-250
-125
-167
VAUXHALL ASTRA (09-16) DIESEL
-250
-100
-119
VOLKSWAGEN GOLF (13- ) DIESEL
-500
25
-182
VOLKSWAGEN PASSAT (11-15) DIESEL
-300
-200
-257
VOLKSWAGEN POLO (09- )
-200
-75
-124
VOLVO V40 (12- ) DIESEL
-425
-75
-126

