
Welcome to our new style overview, previously known as the ‘gold book new car editorial’. Our aim is to bring you improved content and layout, making it easy to identify new and revised information. As always, any customer feedback on this new format would be appreciated: e-mail andrew.mee@cap-hpi.com
The new structure is as follows:
- Headlines - key changes and additions to the overview this month
- Reforecast details this month
- Market conditions
- Historic forecast accuracy
- Forecast methodology
- Sector reforecast schedule 2019-2020
1. Headlines - key changes and additions to the overview this month
Forecast changes
The overall average change in new car forecasts between last month and this month is approximately +2.1% at 36/60, which is slightly more positive than the normal expectation of the seasonal change for full year forecasts between these months, due to the strength of the sectors with have been reforecast.
This month, we publish new reforecasts for the MPV, Convertible and Coupe Cabriolet sectors. The overall impact of the changes to forecasts for these sectors at 36/60 is +4.6%
Details of all values revised by ±5% can be found via the following link: Monthly Reports
See section 2 for more details.
New model ranges added to our forecasts
Bentley Continental GTC, Ford Mondeo, KIA e-Niro, Kia Pro Ceed, Mercedes-Benz B-Class, Porsche 911 and Rolls-Royce Cullinan.
New model ranges to which new derivatives have been added
BMW Z4, Dacia Duster, Dacia Logan, Dacia Sandero, Hyundai Kona, Kia Ceed, Kia Optima, Kia Picanto, Lamborghini Aventador, Mitsubishi ASX, Mitsubishi Eclipse, Mitsubishi Outlander, Skoda Kodiaq, Toyota Corolla, Vauxhall Corsa, Vauxhall Insignia, Volkswagen Passat and Volkswagen Touran.
Market Conditions Changes
At the time of writing, the outcome of Brexit appears even less certain than before, with options including a soft Brexit scenario of the Chequers proposal, a ‘no deal’ hard Brexit scenario, and a possible second referendum including the option to remain in the EU. In our view, even under the hard Brexit scenario, a pragmatic trade deal will be made for the automotive sector that is so important for many European economies. Such a deal should reduce the probability of significant list price increases and disruption to new car supply. Therefore we are still planning to conform to our original timetable of sector reforecasts and do not consider it necessary to embark on a concurrent reforecast of every sector at the same time. We will of course continue to monitor the situation very closely.
The latest figures from ONS show that GDP grew by 0.4% in the three months to October, slower than the 0.6% in the three months to September. These figures are broadly in line with the trend in quarterly growth since 2016.
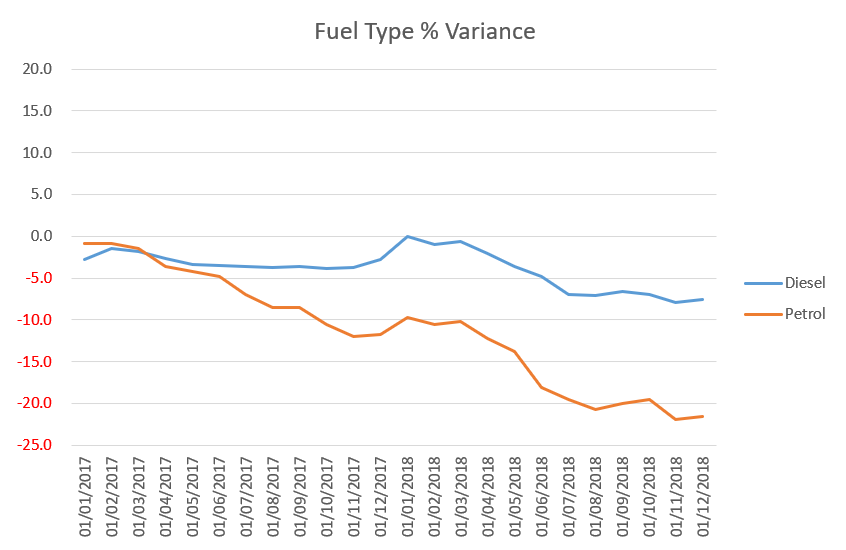
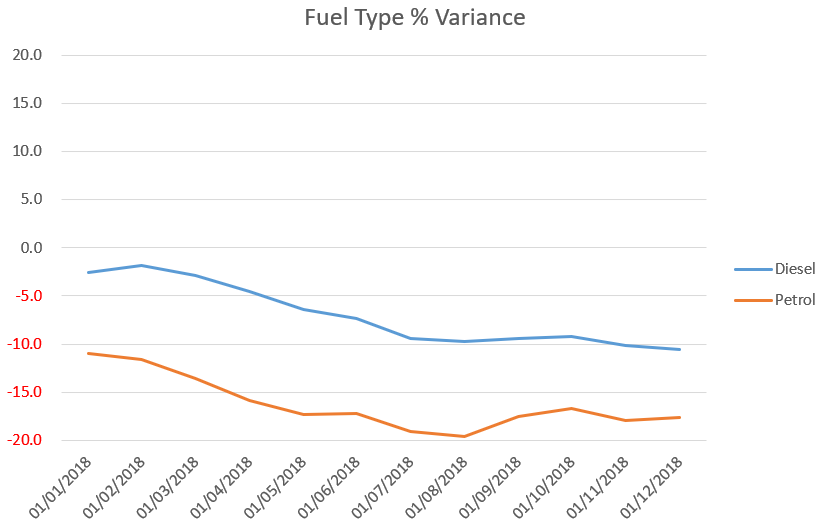
Year to date (to the end of November) UK new car registrations were down -6.9% against 2017, with diesel down -29.8%
The used car market remains strong, aided by the impact of WLTP on new car deliveries and part exchange volumes. As we predicted, the excessive strength of petrol cars in particular is continuing to decline, as more volume comes onto the market. Our forecasts assume that this decline will continue through 2019. Diesel values continue to hold up well, and our forecasts assume that this will continue.
See section 3 for more details.
Historic Forecast Accuracy Changes
Diesel forecast accuracy generally remains within or only just outside our +/-5% target, continuing to be slightly affected by the overall current used market strength.
Petrol forecast accuracy remains outside our +/-5% target, due to the continued strength of the current petrol market. However as this strength is now starting to wane, and the results of previous reforecasts start to come through, accuracy results are expected to improve.
See section 4 for more details
2. Forecast details this month:
This month, we publish our new reforecasts for the MPV, Convertible and Coupe Cabriolet sectors.
The overall impact of the changes at 36/60, split by sector and fuel type, is as follows:
|
SECTOR |
UNDERLYING FORECAST CHANGE |
SEASONAL ELEMENT |
OBSERVED CHANGE December to january |
|
MPV Petrol MPV Diesel Convertible Petrol Convertible Diesel Coupe Cabriolet Petrol Coupe Cabriolet Diesel |
+3.1% +3.1% +3.4% -0.2% +0.4% -3.1% |
+2.0% +1.9% +1.3% +1.3% +1.4% +0.9% |
+5.1% +5.0% +4.7% +1.1* +1.8% -2.2% |
We have not revised our future market deflation assumptions for these sectors, as nothing has happened to alter our view of future supply and demand since the assumptions were last reviewed 5 months ago.
The changes to underlying forecast therefore reflect the movement in current values (black book) since the last reforecast 5 months ago.
The MPV sector continues to be strong for both petrol and diesel, as used volumes have decreased while demand remains strong from purchasers who want this type of vehicle.
Convertible petrol cars have also continued to be strong, while convertible diesel cars have not.
The Coupe Cabriolet sector now only has 2 petrol model ranges and 1 diesel model range.
In addition to reforecasting using the latest black book values, we have also amended walk-ups on the following models in these sectors, to align them to the latest black book research:
Ford C-Max and Grand C-Max petrol and diesel: Titanium X trim walk-up increased.
Ford C-Max and Grand C-Max diesel: 2.0TDCi engine walk-up decreased.
Lotus Exige: 410 Sport trim walk-up decreased.
Volkswagen Sharan petrol and diesel: all trim walk-ups revised.
Other forecast changes this month (in addition to sector reforecasts)
Seat Leon Petrol: Walk-up SE Dynamic (EZ) trim aligned to latest black book research, resulting in increased forecasts.
Seasonality changes
In line with our gold book methodology, all other model ranges which are outside of the sector reforecasts and outside of the other changes listed above, have had their values moved forward from month to month by seasonal factors which are differentiated by sector and fuel type and are based on analysis of historical black book movements.
3. Market Overview
The economy
Despite uncertainty over Brexit (refer to Section 1), the outlook for the UK economy remains unchanged. The latest new independent economic forecasts were published by HM Treasury in November and still do not forecast a recession, so remain in line with our own view. Compared with the previous August forecasts, the new ones show only a slight reduction in GDP from 2020 to 2023.
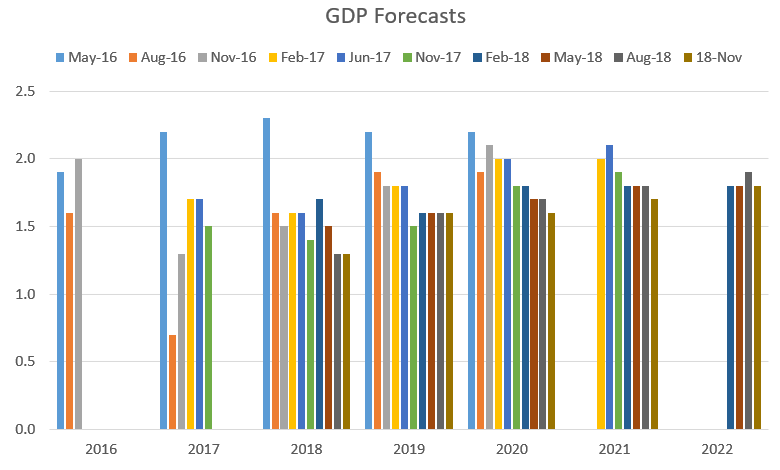
The latest figures from ONS show that GDP grew by 0.4% in the three months to October, slower than the 0.6% in the three months to September (which had been better than expected). These figures are broadly in line with the trend in quarterly growth since 2016, with the UK economy continuing a trajectory of consistent but sluggish growth.
Not all ages and sectors of vehicle are directly impacted by GDP, but for those that are then in some cases lower future registration volumes will offset reduced GDP.
The latest forecasts for inflation and unemployment also show no signs for concern:
The latest figures for CPI and RPI are +2.2% and +4.7%, which are relatively stable.
The unemployment rate remains low at 4.1%, for the 3 months to October.
Despite the base rate interest rate rise in August 2018 to 0.75%, interest rates are expected to remain low for the medium term. Any significant further increase in base rate still seem unlikely until there is a combination of further improvements in wage growth and increases in rates of headline inflation.
Wage growth remains reasonably healthy, although slow by historical standards, and price inflation is now more stable, so these conditions should continue to provide a positive impetus to the overall economy.
Oil prices seem to have stabilised following dramatic price falls during early December, due to concerns over a potential global economic slowdown and continuing supply of crude which outstrips supply. However, some further level of stabilisation is expected in the next few weeks, following the decision by OPEC and others to curb output by more than 1% of global demand during January.
Forecasts for future house price increases vary dramatically by sector and especially by geography. Despite a view expressed by the Bank of England’s Financial Stability Committee that the buy to let sector could “amplify” any boom or bust in the housing market, any negative effects are likely to be centred on London, with the rest of the country significantly more insulated from the impact of any such downturn.
Supply Outlook
Exchange rates are a major influence on the profitability of the UK new car market and they strongly influence eventual used vehicle volumes. Sterling rates against the Euro reduced from around 1.43 in late 2015 to around 1.14 by late 2017, where they have broadly remained. This has limited manufacturers’ scope for heavy discounting and forced registration activity in the UK.
New car registrations in other key European markets continue to grow because of the release of pent up demand, allowing manufacturers to divert volume to these markets. In the three years before the financial crisis, France, Germany, Italy and Spain represented an annual combined volume of almost 9.4 million units. They have recovered to 7.7 million in 2015, then 8.3M in 2016, and then 8.7M in 2017, suggesting there is still further growth to come. The Big 4 look set to come in at +1.6% for 2018, despite a contracting market in Italy and sluggish growth in Germany.
As a result of the exchange rate position and the capacity of other markets, , UK new car registrations for 2017 reflected a ‘true market’ and came in at 2.54M compared with 2016’s 2.69 million (down -5.7%), Most of that fall came from diesel registrations (down -17.1%) as a result of ongoing bad press about air pollution.
It now looks likely that 2018 registrations will be around -7% less than 2017, the further fall being due in part to the production and delivery issues caused by WLTP changes; and diesel registrations will be down around -30% compared with 2017, with most of the shift being into petrol cars.
Looking to the next few years, and subject to the outcome of Brexit, we expect the total UK market to stabilise, with growth in early 2019 due to WLTP delayed deliveries, but the shift out of diesel will continue. There should be increased take-up of alternative fuelled vehicles but this is very dependent on taxation incentives and charging infrastructure. Petrol will remain the dominant fuel type.
Demand outlook and impact on future used values
Contrary to the new car market where diesel share has declined sharply, used diesel values have continued to hold up well (broadly in line with our historic future deflation assumptions) as demand has continued to meet supply
Petrol and hybrid values have been particularly strong (exceeding our historic future deflation assumptions) as buyers seek an alternative to diesel where available. We have always considered this strength will not be sustainable beyond the short term, and there is now clear evidence that the petrol and hybrid market is starting to cool as these cars look too expensive and used supply of these fuel types starts to increase. Also in recent months diesel values have in fact strengthened a little as WLTP has affected the number of part exchanges coming onto the market, and fleets have held onto cars while they await Brexit developments.
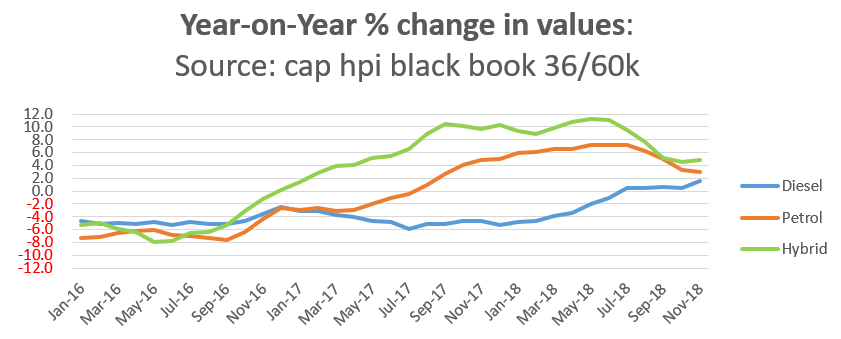
Looking to the next few years, we expect the supply/demand equation to re-stabilise across all fuel types, subject to the outcome of Brexit. Our forecast assumptions are for year-on year deflation broadly in the range of -3% to -6% per annum, varying by sector and fuel type.
There will be an increase in supply of used diesel cars coming onto the market until 2020, as a result higher registration volumes up until 2017. However we expect demand will meet this supply, unless there is widespread implementation of city charging zones for diesel cars in this period, or significant government legislation changes affecting the running costs of diesel cars. We do not consider either of these actions to be likely.
4. Historic Forecast Accuracy:
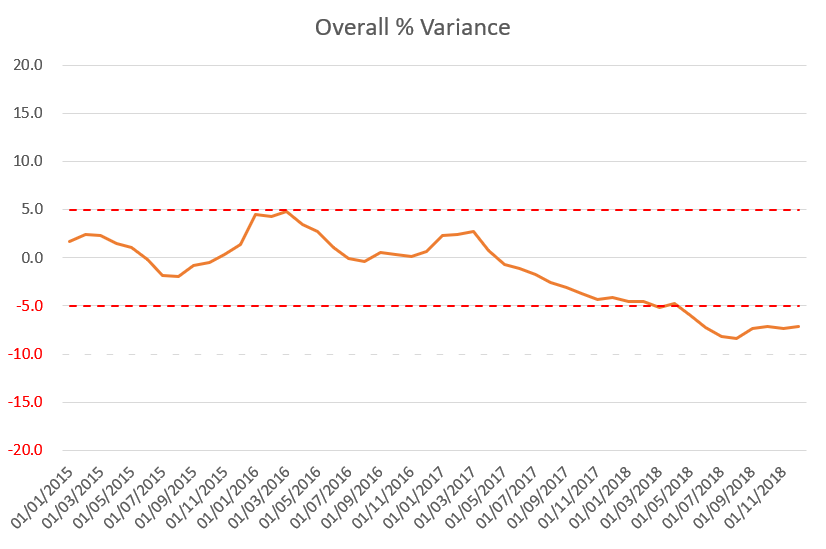
As gold book matures since its introduction in December 2013, we have the data to enable us to measure our results in terms of forecast accuracy. The accuracy target widely demanded by our customers is to be within 5% of actual values and we are pleased that, averaged across all models, gold book has been generally within this target for most of the period since launch.
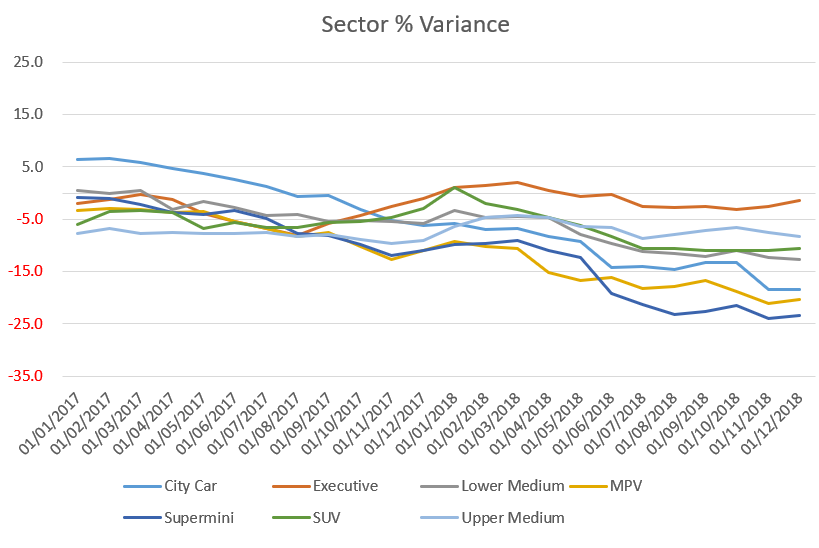
However the unexpected growth in strength of petrol car values through 2017 and into 2018, has resulted in our recent accuracy results showing more under-forecast than was previously the case, especially in the City Car and Supermini sectors. We expect this position to correct over time due the sector reforecasts made in 2017, and our expectation that petrol strength will start to diminish as petrol values peak and more used petrol volume comes into the market. There is clear evidence that this is now starting to happen.
The results of our longer-term forecasts from 3 and 4 years ago have so far shown more under-forecast than the results of our shorter-term forecasts from 1 and 2 years ago. This is largely because the impact of changes made in previous sector reforecasts take longer to flow through into our accuracy results, and that these forecasts were made long before the unexpected rise in petrol values.
In April 2018, we introduced an improved accuracy reporting mechanism, weighted by registration volumes of each model derivate in the month of forecast, and our historic accuracy trends now reflect this weighting.
12 month results
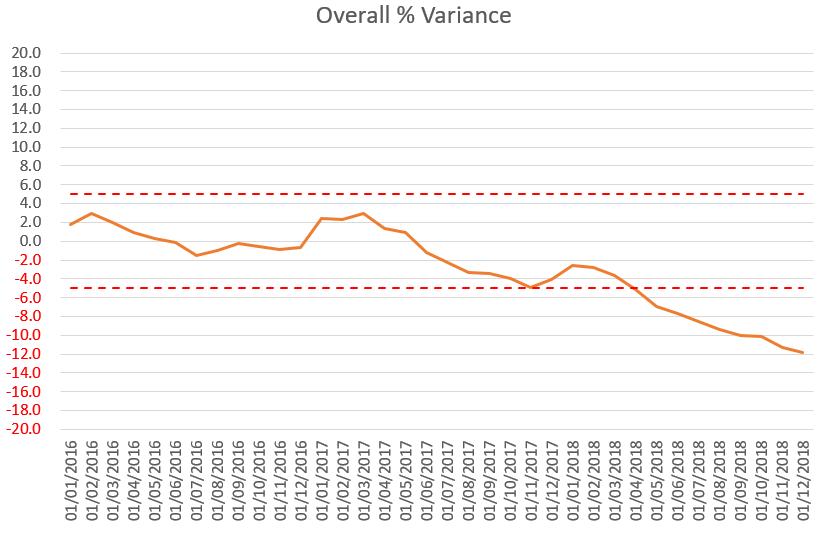
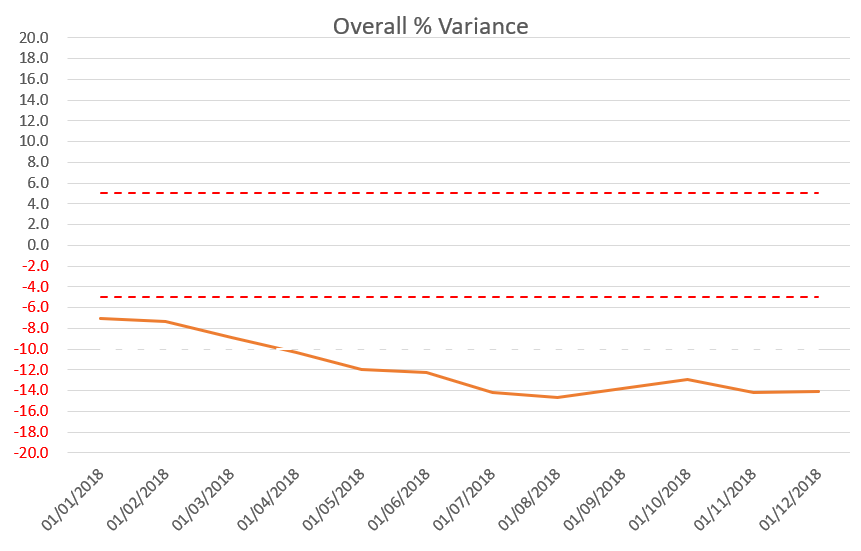
Since measurement started our 12 month forecasts have averaged -1.3% less than black book across all vehicle ids, and the most recent results show December 2017 12/20 gold book forecasts being -7.1% less than December 2018 12/20 black book.
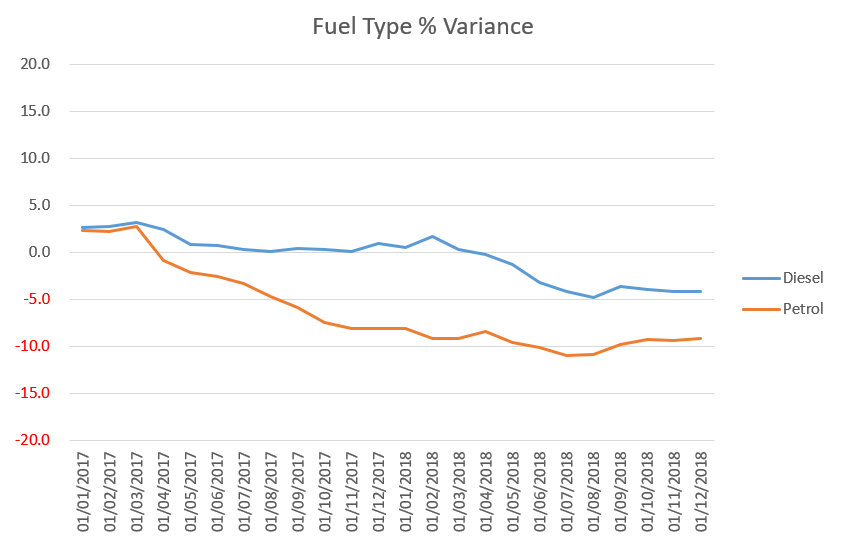
Split by fuel type, and focussing on post 2016 results, diesel accuracy remains within target while petrol accuracy has been adversely affected by the current market strength for petrol.
Split by the main vehicle sectors, most of these have been within target for the majority of the reporting period, except for City Car which was initially over-forecast as a result of unforeseen and prolonged excessive forced registrations, and more recently some sectors (especially City Car, SuperMini and MPV) have been under-forecast due to the unexpected strength of petrol values since 2017. MPV diesel values have also becom unexpectedly strong as demand has outstripped falling supply.
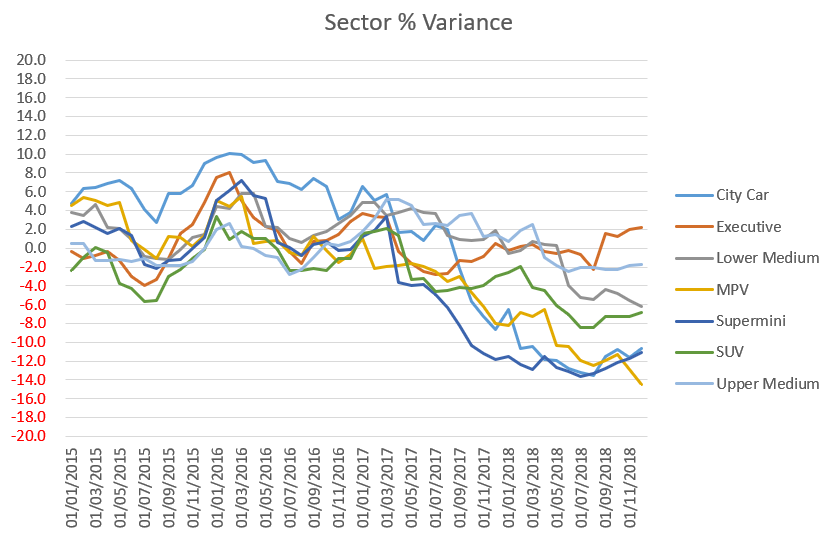
The most recent results for these main sectors are as follows:
|
BB Month |
City Car |
Executive |
Lower Medium |
MPV |
Supermini |
SUV |
Upper Medium |
|
01/12/2018 |
-10.7 |
2.3 |
-6.2 |
-14.5 |
-11.1 |
-6.9 |
-1.7 |
24 month results
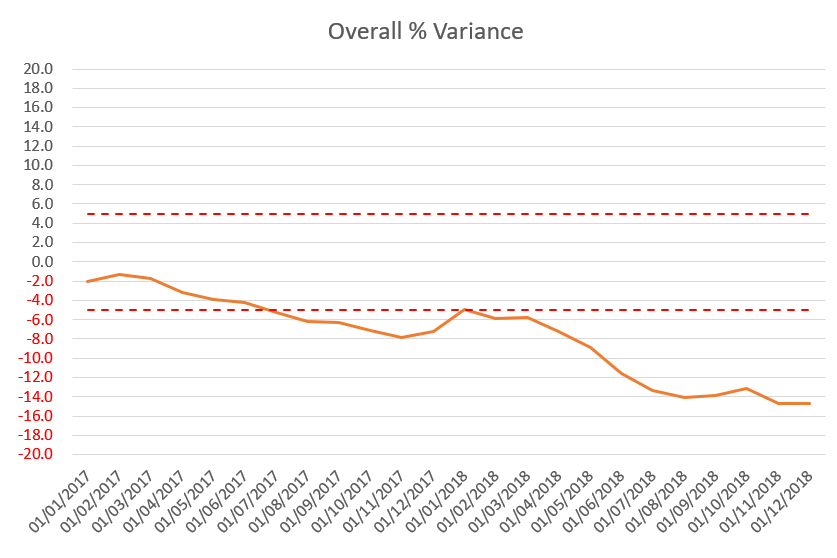
Since measurement started our 24 month forecasts have averaged -2.8% less than black book across all vehicle ids, and the most recent results show December 2016 24/40 gold book forecasts being -11.9% less than December 2018 24/40 black book.
Split by fuel type, and focussing on post 2016 results, diesel accuracy has only recently fallen outside target, while petrol accuracy has been much more adversely affected by the current market strength for petrol.

Split by the main vehicle sectors, most of these have been within target for the majority of the reporting period, except for City Car which was initially over-forecast as a result of unforeseen and prolonged excessive forced registrations, and more recently some sectors (especially City Car, SuperMini and MPV) have been under-forecast due to the unexpected strength of petrol values since 2017. MPV diesel values have also become unexpectedly strong as demand has outstripped falling supply.
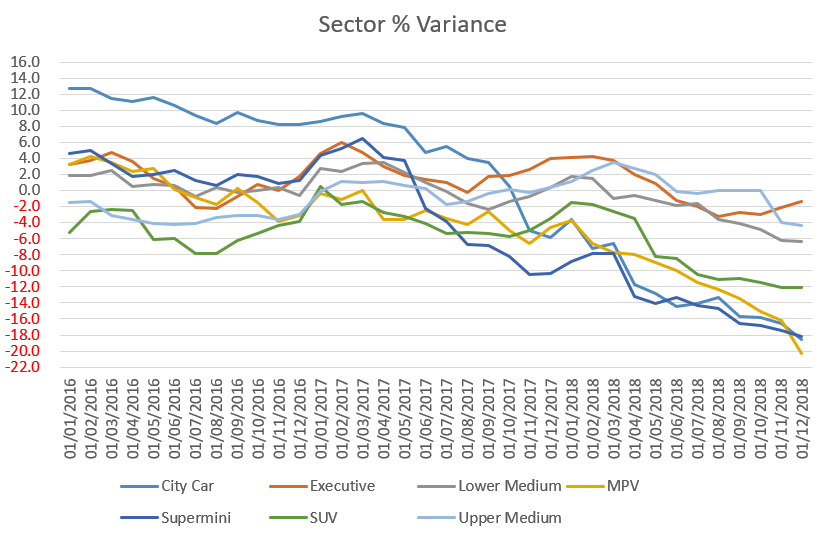
The most recent results for these main sectors are as follows:
|
BB Month |
City Car |
Executive |
Lower Medium |
MPV |
Supermini |
SUV |
Upper Medium |
|
01/12/2018 |
-18.5 |
-1.3 |
-6.4 |
-20.3 |
-18.2 |
-12.1 |
-4.4 |
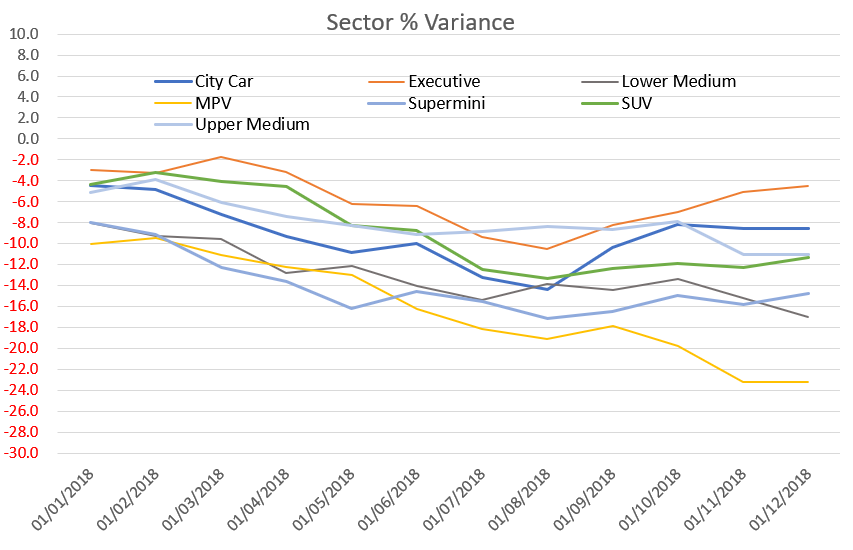
36 month results
Since measurement started our 36 month forecasts have averaged -7.7% less than black book across all vehicle ids, and the most recent results show December 2015 36/60 gold book forecasts being -14.7% less than December 2018 36/60 black book.
Split by fuel type, diesel accuracy has been within target until very recently, while petrol accuracy has been much more adversely affected by the current market strength for petrol.
Split by the main vehicle sectors, most of these have been outside the under-forecast
target for the majority of the reporting period, most notably City Car, Supermini and MPV. As previously stated, this largely due to the unexpected strength of petrol values since 2017, which was not foreseen when setting forecasts 3 years ago. MPV diesel values have also become unexpectedly strong as demand has outstripped falling supply.
The most recent results for these main sectors are as follows:
|
BB Month |
City Car |
Executive |
Lower Medium |
MPV |
Supermini |
SUV |
Upper Medium |
|
01/12/2018 |
-18.5 |
-1.4 |
-12.7 |
-20.3 |
-23.4 |
-10.6 |
-8.4 |
48 month results
Since measurement started our 48 month forecasts have averaged -11.8% less than black book across all vehicle ids, and the most recent results show December 2014 48/80 gold book forecasts being -14.1% less than December 2018 48/80 black book.
Split by fuel type, diesel accuracy has been more accurate than petrol accuracy, which has been much more adversely affected by the current market strength for petrol.
Split by the main vehicle sectors, most of these have been outside the under-forecast target for the majority of the reporting period, notably City Car, Supermini and MPV. As previously stated, this largely due to the unexpected strength of petrol values since 2017, which was not foreseen when setting forecasts 4 years ago. MPV diesel values have also becomen unexpectedly strong as demand has outstripped falling supply.
The most recent results for these main sectors are as follows:
|
BB Month |
City Car |
Executive |
Lower Medium |
MPV |
Supermini |
SUV |
Upper Medium |
|
01/12/2018 |
-8.6 |
-4.5 |
-17.0 |
-23.2 |
-14.8 |
-11.4 |
-11.0 |
Overall results
In general, we are satisfied with these accuracy results since the launch of gold book, despite the recent fall-off in accuracy due to current market conditions, which we do not expect to last. We are taking advantage of our new methodology to implement a ‘virtuous feedback loop’, with each element of the forecast examined to determine how best to further improve the accuracy of our future value forecasts, while also reducing variation. This has shown itself to be effective over the relatively long period we have been measuring 12 and 24 month results, and we expect the same to be true of our future 36 and 48 month results.
We will continue to publish these results and share them with our customers.
5. Gold Book Methodology
Overview
All of our future residual values are based on the gold book methodology. Our values take current month black book values as a starting point (uplifted for model changes where necessary), are moved forward according to age/sector/fuel specific year on year deflation assumptions regarding future used car price movements, and are then subjected to additional adjustments by the Editorial Team. Finally, the values are moved forward by the next month’s seasonality adjustments which are differentiated by sector and fuel type and are based on analysis of historical black book movements.
All of these assumptions and adjustments are available for scrutiny to our customers through our gold book iQ product. For years our customers have been asking for transparency in automotive forecasting and we have delivered a ground-breaking product to provide exactly that.
With an increasing number of customers subscribing to gold book iQ, we are entering into a range of debates and discussions around both our overall forecasting methodology and individual elements of the forecasts for particular vehicles. This is expected to evolve over time into a ‘virtuous circle’, with the feedback looping back into the forecast process and delivering continuous improvement. We are embracing a new era of customer communication, with a greatly improved quality of interaction and debate around our forecast values.
Changes may be actioned wherever there is reason to do so outside of the sector reforecast process and we continue our monthly Interproduct analysis with our black book colleagues exactly as before. This has intensified following the availability of our short term forecast data (gold book 0-12, now available to customers), which incorporates detailed exception reporting at a cap hpi ID level and will also be used increasingly going forward to manage the relationships between black book and gold book.
Forecasting Model Development - gold book & iQ
gold book iQ was launched in December 2013 and gives unparalleled transparent insight into the assumptions used to produce our forecasts.
Our short-term forecast product, gold book 0-12, (also marketed as black book +12) was launched shortly afterwards. This is a live, researched product with a dedicated editor and fills a gap in our previous forecast coverage.
Following feedback on our gold book iQ product, from September 2016 we have added more detail into the commentary for each model range reforecast in sector reviews.
In December 2017 we introduced a daily feed of forecasts for new models launched onto the market, so that customers do not have to wait until the next month to receive these forecasts.
Forecast Output
Individual forecasts are provided in pounds and percentage of list price for periods of twelve to sixty months with mileage calculations up to 200,000.
Each forecast is shown in grid format with specific time and mileage bands highlighted for ease of use.
All forecast values include VAT and relate to a cap hpi clean condition and in a desirable colour.
All new car prices in gold book include VAT and delivery.
Parallel Imports
Particular care must be taken when valuing parallel imports. Vehicles are often described as full UK specification when the reality is somewhat different. These vehicles should be inspected to ensure that the vehicle specification is correct for the UK. Parallel imports that are full UK specification and first registered in the UK can be valued the same as a UK-sourced vehicle.
Grey Imports
cap hpi gold book does not include valuations for any grey import vehicles, (i.e. those not available on an official UK price list).
6. Reforecast Calendar 2019/2020:
Monthly Product
Sector 1
Sector 2
Sector 3
Sector 4
Feb-19
Mar-19
Apr-19
May-19
June-19
Jul-19
Aug-19
Sep-19
Oct-19
Nov-19
Dec-19
Jan-20
Lower Medium
City Car
SUV
Upper Medium
MPV
Lower Medium
City Car
SUV
Upper Medium
MPV
Lower Medium
City Car
Sports
Supermini
Electric
Executive
Convertible
Sports
Supermini
Electric
Executive
Convertible
Sports
Supermini
Supercar
Large Executive
Coupe Cabriolet
Supercar
Large Executive
Coupe Cabriolet
Supercar
Luxury Executive
Luxury Executive

