
Welcome to the latest version of our overview, previously known as the ‘gold book new car editorial’. Our aim is to bring you the best content and layout, making it easy to identify new and revised information. As always, any customer feedback would be appreciated: e-mail andrew.mee@cap-hpi.com
The new structure is as follows:
- Headlines - key changes and additions to the overview this month
- Reforecast details this month
- Market conditions
- Historic forecast accuracy
- Forecast methodology
- Sector reforecast schedule 2019-2020
1. Headlines - key changes and additions to the overview this month
Forecast changes
The overall average change in new car forecasts between last month and this month is approximately +1.9%% at 36/60, which is broadly in line with the normal expectation of the seasonal change for full year forecasts between these months.
This month, we publish new reforecasts for the City Car and Supermini sectors. There have been no changes to our future market deflation assumptions. The overall impact of the changes to forecasts for these sectors at 36/60 is +4.2%.
Details of all values revised by ±5% can be found via the following link Monthly Reports
See section 2 for more details on forecast changes.
New model ranges added to our forecasts
Aston Martin DBX, Audi A5 Cabriolet, Audi A5 Coupe, Audi A5 Sportback, Audi A6, Audi A7, Audi A8, Audi e-tron, Audi RS 4, Audi RS 5 Coupe, Audi RS 5 Sportback, Audi S5 Coupe, Audi S5 Sportback, Audi S8, Citroen C5 Aircross, Hyundai i10, Mercedes-Benz GLE Coupe, Mini Hatchback, Mitsubishi Mirage and Polestar 2.
New model ranges to which new derivatives have been added
Audi R8, Audi RS 6, Audi RS 7, Audi RS Q8, Fiat 500, Fiat Panda, Fiat Tipo, Ford Fiesta, Ford Puma, Kia e-Niro, Kia Niro, Lamborghini Aventador, Land Rover Range Rover Velar, Mercedes-Benz E Class Cabriolet, Mercedes-Benz E Class Coupe, Mercedes-Benz GLE, Mercedes-Benz SLC, MG MG3, Nissan X-Trail, Seat Ateca, Seat Tarraco, Volkswagen Grand California, Volkswagen T-Cross and Volkswagen Up.
Market Conditions Changes
We now have a newly elected Conservative government with a significant majority, which has brought improved clarity regarding Brexit. We can rule out another referendum and it looks likely that Boris Johnson’s withdrawal agreement will be passed, maybe with some amendments, and that we will leave the EU in an orderly fashion on the 31st of January.
We will then enter into a transition period to agree new trading agreements. At present this is expected to be concluded by the end of 2020, but it may be extended. The transition period means that there is likely to be little or no significant Brexit impact on the UK car market during 2020.
The pound to euro exchange rate has moved closer to 1.20 euros to the pound since the election, but it remains to be seen whether this is a short term reaction or longer term change which may improve UK profitability for car manufacturers.
The unemployment rate has fallen in December to a 45 year low of 3.8%
New independent forecasts for the UK economy were published on 18th December, and are little changed from previous forecasts: GDP growing slowly to 1.7 by 2022/2023, CPI remaining at around 2%, and unemployment rate remaining at around 4%. The Bank of England Base rate is forecast to increase gradually from 0.75% to 1.44% by 2023.
SMMT figures show UK new car registrations up to the end of November 2019 were down -2.7% against 2018, with diesel down -22%; broadly in line with our expectations.
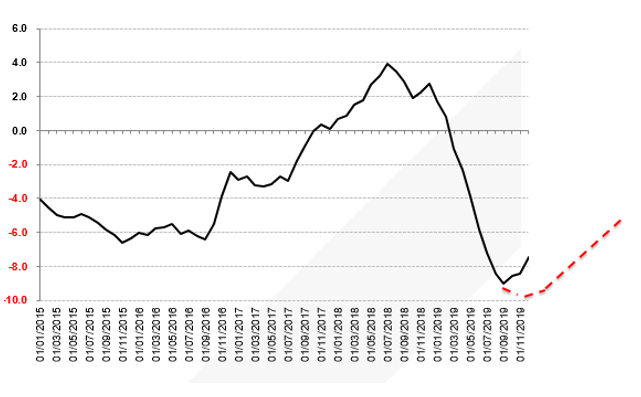
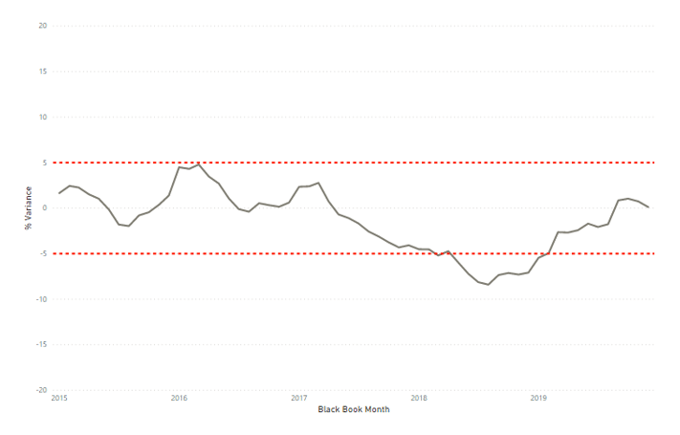
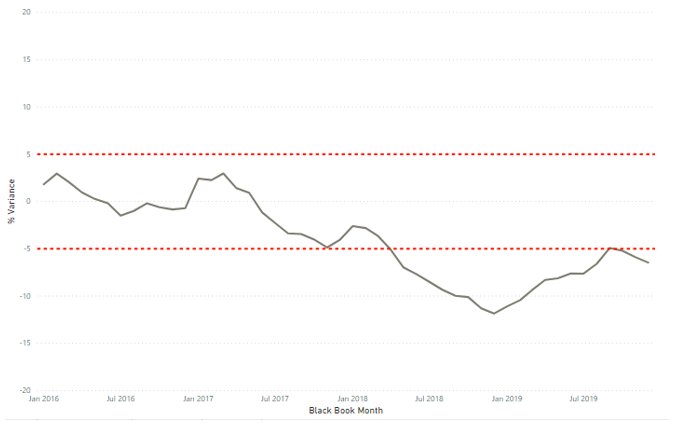
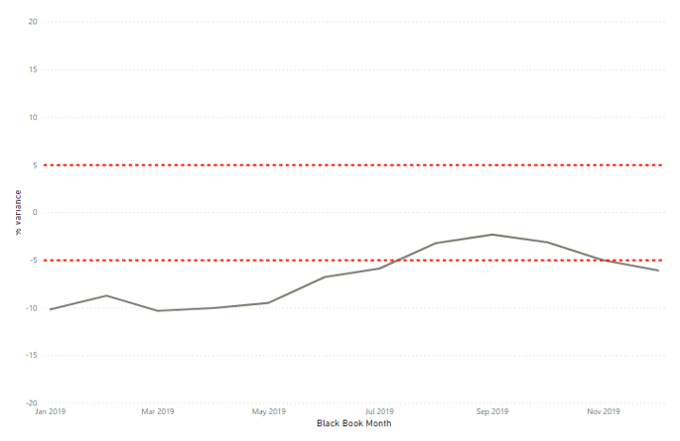
The heavy fall in used car values seen earlier in the year has now stopped, consistent with our view expressed in late summer that we expected monthly seasonal changes to return to more normal levels towards the end of 2019. The chart below shows year-on-year average percentage change in used values at 36/60k, comparing actual change as far as December (black line), against our future expectation published in September (red line). We have clearly turned the corner, and with December looking like an unusually strong month for used values, we expect improvement in year-on-year change will continue into 2020, as per our prediction.
See section 3 for more details on market conditions changes.
Historic Forecast Accuracy Changes
We are pleased that our 12 month forecasts from 1 year ago, which included the expected 2019 market correction, have proved very accurate with only 0.1% difference to todays’ values averaged across all IDs, and with very little variance between diesel and petrol.
Accuracy of older longer-term forecasts has been affected by the unexpected turbulence in used values over the last 2 years, caused by anti-diesel press boosting petrol values in particular to unsustainable levels, followed by the market correction in 2019. These older forecast results will improve over time, as the changes made in our 5-monthly sector reviews start to flow into the results.
See section 4 for more details on accuracy.
2. Forecast details this month:
This month, we publish our new reforecasts for the Lower Medium, Sports and Supercar sectors.
The overall impact of the changes at 36/60k, split by sector and fuel type, is as follows:
|
SECTOR |
UNDERLYING FORECAST CHANGE |
SEASONAL ELEMENT |
OBSERVED CHANGE DECEMBER TO JANUARY |
|
City Car Petrol City Car Diesel
Supermini Petrol Supermini Diesel |
4.1% 1.7%
1.8% 2.3% |
2.7% 2.6%
1.7% 2.0% |
6.8% 4.3%
3.5% 4.3% |
We have not altered our future market deflation assumptions for these sectors, so the underlying forecast changes are a result of the change in current market values (black book) over the 5 months since the last sector reforecasts, and the impact of model aging into lifecycle.
Both of these sectors, being composed of the smallest and cheapest cars, tend to led the way when market conditions change, and this has been true recently as the market has started to strengthen since their last sector reforecasts 5 months ago. This has meant a higher start point for our new re-forecasts, and with the positive January seasonality movement, this has resulted in forecast increases for many model ranges.
The largest average increase is for City Car petrol, and we are comfortable with this. Used supply and choice will fall in future years: there are now only 12 model ranges available in the new market; and total registration volumes continue to fall (down 7% in 2016, down 15% in 2017, down 14% in 2018, and looking like a further 13% fall in 2019). Therefore, demand should be relatively strong for City Car petrol in future years.
Ford Ka Plus the only City Car diesel range available in the new car market.
Diesel model range choice in the Supermini sector continues to decline: there are now only 9 model ranges available in the new car market, compared to 27 petrol ranges. So although demand for used diesel Superminis will fall in future years, the supply will also fall, and we are comfortable with the increased forecasts.
Reforecast History for these sectors
The tables below summarise the 36/60 forecast changes for these sectors since the start of 2018, to provide some historical context against which to compare the latest reforecasts.
|
Book Month |
Sector |
Underlying Forecast Change |
Seasonal element |
Observed Change vs previous month |
|
Aug-19 |
City Car Petrol |
-4.8 |
-0.9 |
-5.7 |
|
Aug-19 |
City Car Diesel |
-0.5 |
-1.1 |
-1.6 |
|
Mar-19 |
City Car Petrol |
-1.5 |
4.3 |
2.8 |
|
Mar-19 |
City Car Diesel |
0.4 |
4.6 |
5.0 |
|
Oct-18 |
City Car Petrol |
4.2 |
0.2 |
4.4 |
|
Oct-18 |
City Car Diesel |
3.8 |
-0.5 |
3.3 |
|
May-18 |
City Car Petrol |
0.1 |
-2.2 |
-2.1 |
|
May-18 |
City Car Diesel |
2.0 |
-1.1 |
0.9 |
|
Aug-19 |
Supermini Petrol |
-2.8 |
-1.2 |
-4.0 |
|
Aug-19 |
Supermini Diesel |
-4.3 |
-0.9 |
-5.2 |
|
Mar-19 |
Supermini Petrol |
1.1 |
4.5 |
5.6 |
|
Mar-19 |
Supermini Diesel |
0.0 |
4.7 |
4.7 |
|
Oct-18 |
Supermini Petrol |
4.3 |
0.5 |
4.8 |
|
Oct-18 |
Supermini Diesel |
2.2 |
0.4 |
2.6 |
|
May-18 |
Supermini Petrol |
1.0 |
-1.7 |
-0.7 |
|
May-18 |
Supermini Diesel |
0.7 |
-1.7 |
-1.0 |
Walk-up changes within these sectors
As part of the sector reforecasts published this month, we have also reviewed and amended walk-ups on the following models, to align them to the latest black book research. Many of these changes were to a significant number of walk-ups, some of which were positive and some negative, so it is not possible to list all the detail within this document.
|
Sector |
Generation |
Comment |
|
Supermini |
BMW MINI COOPER (18- ) |
Auto transmission increased |
|
Supermini |
BMW MINI COOPER S (18- ) |
Auto transmission increased |
|
Supermini |
CITROEN C3 (16- ) |
Full walk-up re-alignment |
|
Supermini |
CITROEN C3 (16- ) DIESEL |
Flair trim reduction |
|
Supermini |
DACIA SANDERO (13- ) |
Full walk-up re-alignment |
|
Supermini |
DACIA SANDERO (13- ) DIESEL |
Full walk-up re-alignment |
|
Supermini |
DS DS3 (15- ) |
Manual transmission decreased |
|
Supermini |
FORD FIESTA (17- ) |
Auto transmission increased |
|
Supermini |
FORD FIESTA (17- ) DIESEL |
Vignale and Vignale Edition trims reduced |
|
Supermini |
HONDA JAZZ (15- ) |
Full walk-up re-alignment |
|
City Car |
HYUNDAI I10 (14- ) |
1.0 [66] engine reduced |
|
Supermini |
KIA RIO (16- ) |
Full walk-up re-alignment |
|
City Car |
RENAULT TWINGO (14- ) |
Auto transmission increased |
|
Supermini |
SKODA FABIA (18- ) |
Full walk-up re-alignment |
|
City Car |
SMART FORFOUR (14- ) |
Full walk-up re-alignment |
|
City Car |
SMART FORTWO (14- ) |
Full walk-up re-alignment |
|
Supermini |
SUZUKI SWIFT (17- ) |
Auto transmission increased |
|
Supermini |
TOYOTA YARIS (17- ) |
Auto transmission increased |
|
City Car |
VAUXHALL ADAM (12- ) |
Auto transmission increased |
|
Supermini |
VOLKSWAGEN POLO (17- ) |
Full walk-up re-alignment |
Other forecast changes this month (in addition to sector reforecasts)
Audi RS Q8:
Reforecast ahead of schedule, following analysis of forecast relationship with Audi Q8, resulting in increased forecasts.
Audi RS4 Avant IDs 91991, 92032 and 91992:
Facelift walk-up added, resulting in increased forecast.
BMW 5 series Hybrid:
Reforecast ahead of schedule, following inter-product analysis of black and gold book value relationships, resulting in decreased forecasts.
BMW 7 series Hybrid:
Reforecast ahead of schedule, following inter-product analysis of black and gold book value relationships, resulting in decreased forecasts.
Land Rover Range Rover Evoque Petrol:
Reforecast ahead of schedule, following inter-product analysis of black and gold book value relationships, resulting in decreased forecasts.
Lexus RX:
Walk-up change to base variants after further information received from manufacturer, resulting in increased forecasts.
Mercedes E Class Petrol:
Reforecast ahead of schedule, following inter-product analysis of black and gold book value relationships, resulting in decreased forecasts.
Mercedes E Class Cabriolet Petrol and Diesel
Walk-up change to Premium and Premium Plus, resulting in increased forecasts.
Mercedes G Class Diesel:
Reforecast ahead of schedule, following inter-product analysis of black and gold book value relationships, resulting in decreased forecasts.
Rolls Royce Phantom:
Reforecast ahead of schedule, following inter-product analysis of black and gold book value relationships, resulting in decreased forecasts.
Seat Tarracco Diesel:
Reforecast ahead of schedule, following inter-product analysis of black and gold book value relationships, resulting in decreased forecasts.
Vauxhall Combo Life Petrol:
Reforecast ahead of schedule, following inter-product analysis of black and gold book value relationships, resulting in decreased forecasts.
VW Golf Electric:
Reforecast ahead of schedule, following inter-product analysis of black and gold book value relationships, resulting in decreased forecasts.
Volvo S60 Petrol:
Reforecast ahead of schedule, following inter-product analysis of black and gold book value relationships, resulting in decreased forecasts.
Seasonality changes
In line with our gold book methodology, all other model ranges which are outside of the sector reforecasts and outside of the other changes listed above, have had their forecasts moved forward from month to month by seasonal factors which are differentiated by sector and fuel type and are based on analysis of historical black book movements.
3. Market Overview
The economy
We now have a newly elected Conservative government with a significant majority, which has brought improved clarity regarding Brexit. We can rule out another referendum and it looks likely that Boris Johnson’s withdrawal agreement will be passed, maybe with some amendments, and that we will leave the EU in an orderly fashion on the 31st of January.
We will then enter into a transition period to agree new trading agreements. At present this is expected to be concluded by the end of 2020, but it may be extended. The transition period means that there is likely to be little or no significant Brexit impact on the UK car market during 2020.
The outlook for the UK economy remains unchanged. The latest independent economic forecasts were published by HM Treasury on 18th December and remain positive.
GDP is forecast to slowly increase to 1.7 by 2022/2023.
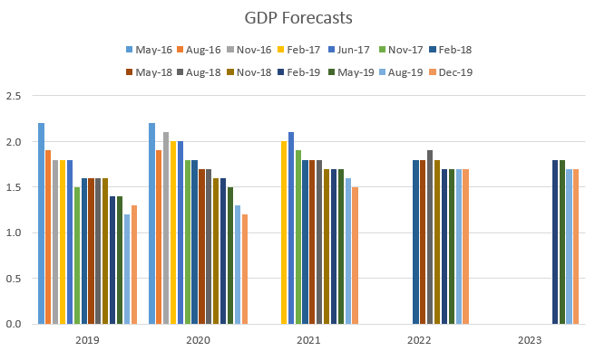
These forecasts are consistent with the recent history of GDP growth, and with the trend in quarterly growth since 2016, with the UK economy continuing a trajectory of consistent but sluggish growth.
Not all ages and sectors of vehicle are directly impacted by GDP, but for those that are then in some cases lower future registration volumes will offset reduced GDP.
CPI is currently running at 1.5% (December 2019); and the average of the latest independent forecasts (December 2019) are for it to remain around 2% over the next 5 years.
Unemployment is currently running at a 45 year low of 3.8% (December 2019); and the average of the latest independent forecasts (December 2019) are for it to remain around 4% over the next 5 years.
Interest rates are expected to remain low, with the latest independent forecasts (December 2019) predicting a modest rise from 0.75% today to 1.44% by 2023.
Wage growth remains reasonably healthy, although slow by historical standards, and price inflation is now more stable, so these conditions should continue to provide a positive impetus to the overall economy.
Oil prices seem to have stabilised following the decision by OPEC and others to curb output...
Forecasts for future house price increases vary dramatically by sector and especially by geography. Despite a view expressed by the Bank of England’s Financial Stability Committee that the buy to let sector could “amplify” any boom or bust in the housing market, any negative effects are likely to be centred on London, with the rest of the country significantly more insulated from the impact of any such downturn.
Supply Outlook
Exchange rates are a major influence on the profitability of the UK new car market and they strongly influence eventual used vehicle volumes. Sterling rates against the Euro reduced from around 1.43 in late 2015 to around 1.14 by late 2017, where they have broadly remained. This has limited manufacturers’ scope for heavy discounting and forced registration activity in the UK. The rate has improved to closer to 1.20 since the Election, but it remains to be seen whether this is a short term reaction or longer term change which may improve UK profitability for car manufacturers.
New car registrations in other key European markets continue to grow because of the release of pent up demand, allowing manufacturers to divert volume to these markets. In the three years before the financial crisis, France, Germany, Italy and Spain represented an annual combined volume of almost 9.4 million units. They have recovered to 7.7 million in 2015, 8.3M in 2016, 8.7M in 2017 and 8.85M in 2018, suggesting there is still further growth to come, despite a contracting market in Italy and sluggish growth in Germany.
As a result of the exchange rate position and the capacity of other markets, UK new car registrations have fallen since 2016:
2016: 2.69M
2017: 2.54M (-5.7% reduction)
2018: 2.37M (-6.8% reduction)
2019: 2.3M (-3% reduction) – estimate with 1 month to go.
Diesel registrations have seen the heaviest fall, with market share now down to 25.4% (November 2019) compared to around 50% at its peak only a few years ago.
Looking to the next few years, and subject to the final outcome of Brexit, we expect the total UK market to stabilise, and then possible start to grow slowly if GDP forecasts materialise and exchange rates remain relatively stable.
The shift out of diesel will continue, but the rate of decline will slow down as we reach the hard core of drivers for whom diesel makes sense, and there could be return to diesel from some drivers who switched to petrol but have not liked the increase in fuel costs. Petrol will remain the dominant fuel type, with an increasing proportion including mild hybrid technology to reduce CO2 and improve consumption.
There should be increased take-up of alternative fuelled vehicles but this is very dependent battery production and supply; and on taxation incentives and charging infrastructure. The new zero BIK rate for Battery EVs in 2020 is welcome, and should boost sales.
Demand outlook and impact on future used values
Contrary to the new car market where diesel share has declined sharply since 2016, used diesel values have continued to generally hold up well over the same period (broadly in line with our historic future deflation assumptions) as demand has continued to meet supply. There was a temporary peak in strength in late 2018 when WLTP interrupted new car and part exchange supply, and then a market correction downturn after this.
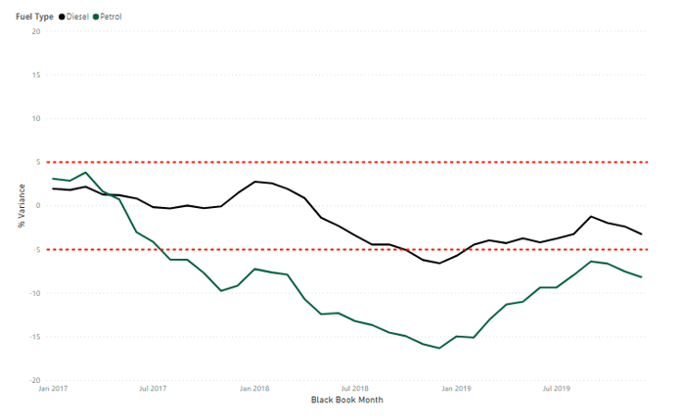
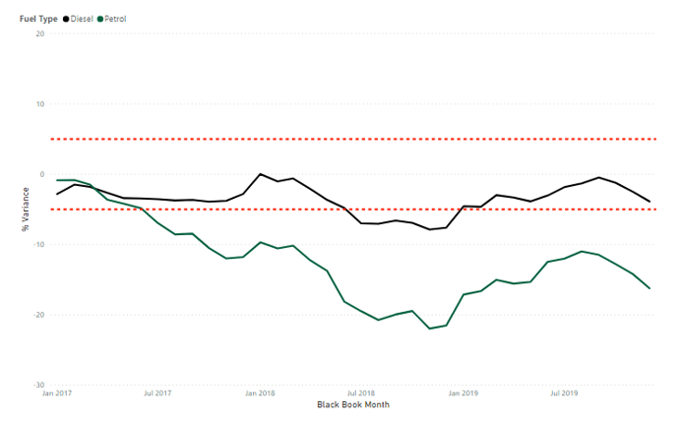
Petrol and hybrid values were particularly strong (exceeding our historic future deflation assumptions) up to late 2018, as buyers sought an alternative to diesel where available. We always considered this strength to be unsustainable, and since 2018 this strength has quickly dissipated. There is still some remaining strength in hybrid cars, where volumes remain low.
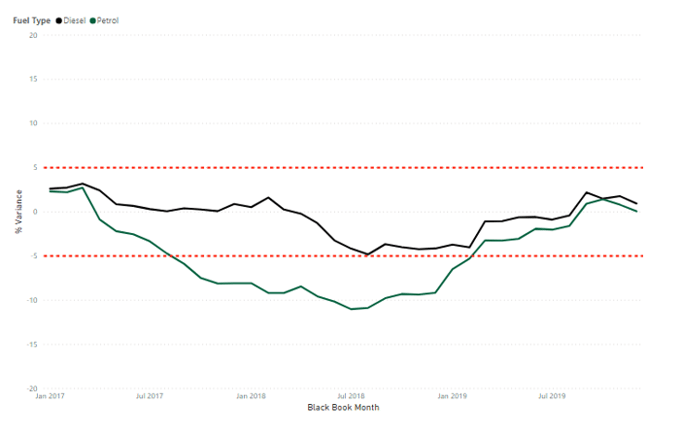
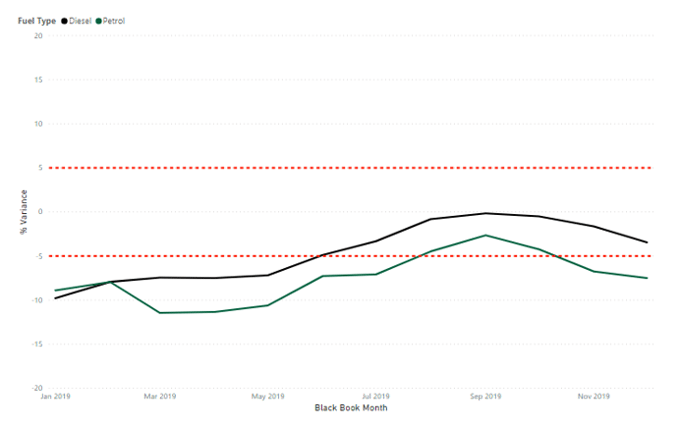
The following chart shows the average year-on-year percentage change in value of the same model (cap id) at 36/60k, split by fuel type.
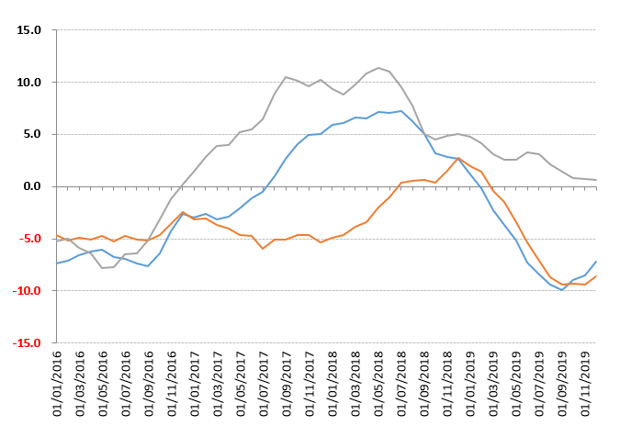
As we predicted, the worsening of YOY deflation is now turning a corner as we approach the end of the year, and as we move through 2020 we expect deflation to continue to improve, as the effect of 2018 strength will have washed through.
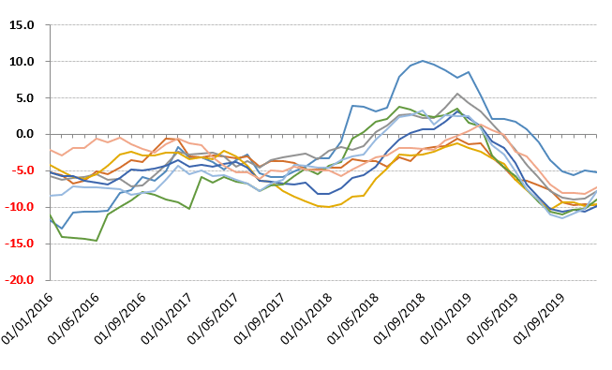
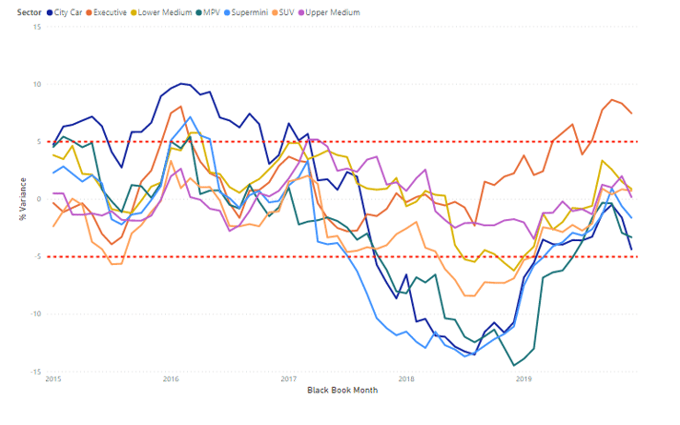
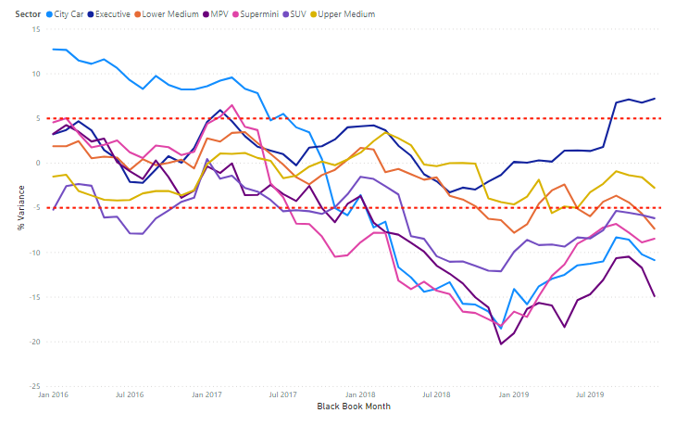
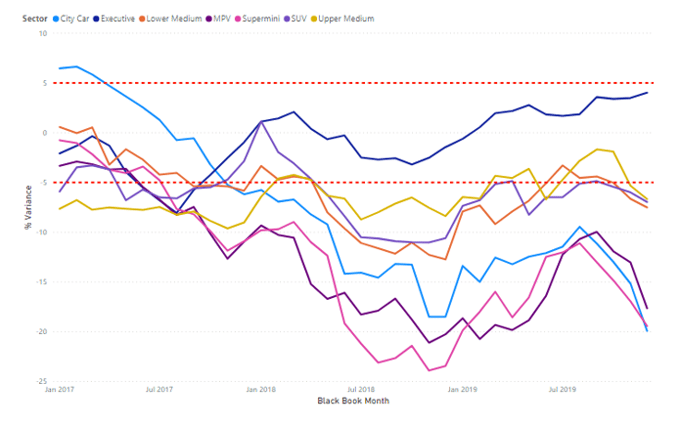
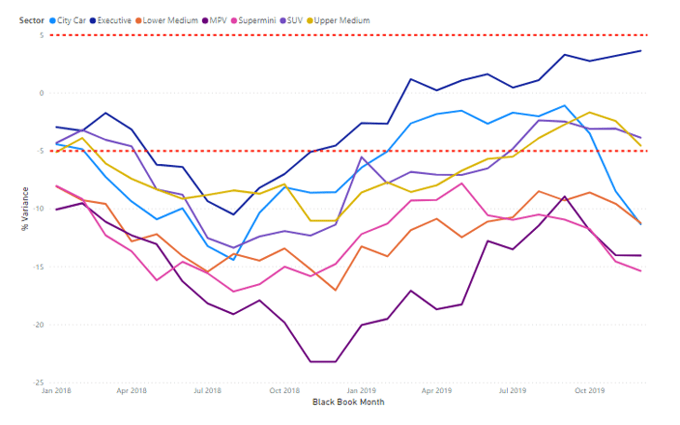
In the main vehicle sectors, petrol values have shown similar YOY trends since 2016, as shown in the following chart:
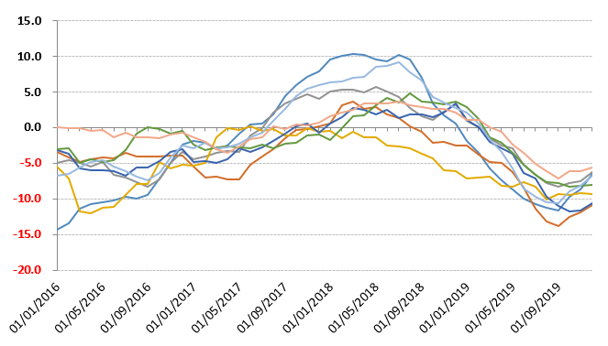
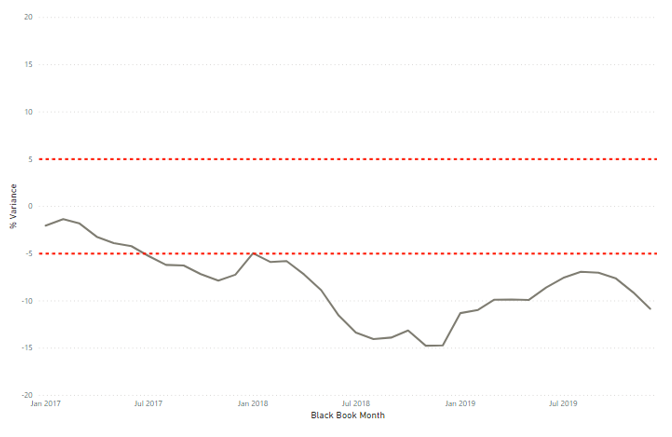
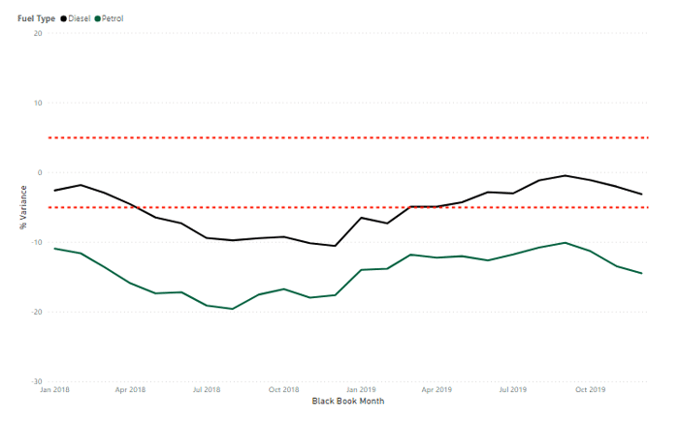
Similarly in the main vehicle sectors, diesel values have also shown similar YOY trends since 2016, as shown in the following chart:
Looking to the next few years, we expect the supply/demand equation to re-stabilise across all fuel types, subject to the outcome of Brexit. Our forecast assumptions are for year-on year deflation broadly in the range of -3% to -6% per annum, varying by sector and fuel type.
There will be an increase in supply of used diesel cars coming onto the market until late 2020, as a result higher registration volumes up until 2017. However we expect demand will meet this supply, unless there is widespread implementation of city charging zones for diesel cars in this period, or significant government legislation changes affecting the running costs of diesel cars. We do not consider either of these actions to be likely in that timeframe.
4. Historic Forecast Accuracy:
Since the introduction of gold book at the end of 2013, we have been able to track the accuracy of historic forecasts against current (black book) values. This tracking is longest for 12 month forecasts (tracked since January 2015) and shortest for 60 month forecasts (tracked since January 2019).
Overall we are satisfied that accuracy results are generally been within the +/- 5% target agreed with customers, but recognise that results have been affected by the unexpected strength of petrol values which started in 2017 as a result of anti-diesel press, but which has fallen away since late 2018, as we had always predicted. Diesel forecast accuracy has generally been within target, while petrol forecast accuracy fell outside of target during the period of strong values.
Our historic forecast accuracy has now improved as a result of this cooling of current petrol values during 2019, and also as a result of historic sector reforecasts that took petrol strength into account now starting to flow through in to the accuracy results. This flow has happening with 12 month forecasts, is happening with 24 month forecasts, and will move on to 36, 48, and 60 month forecasts in future years.
Therefore the tracking charts below all show the same general pattern of returning to improving results, with the difference to target being less for 12 month forecasts (reforecast most recently); and being more for longer term forecasts (reforecast less recently).
City Car forecast accuracy, followed by Supermini, have been most volatile over the long term, partly as a result of variable manufacturer behaviour regarding forced registrations, and partly because their low pound values results in relatively large percentage figures.
More recently, MPV forecast accuracy has been affected by the strength in values due to demand outstripping supply; but sector reforecasts have taken this into account, and will flow through into improved results in the future.
Also recently, Executive sector forecast accuracy has shown our forecasts to be too high, and again recent sector reforecasts for Executive should improve accuracy when these flow into results.
12 month results
Since measurement began our 12 month forecasts have averaged -1.4% less than black book across all vehicle ids, and the most recent results show December 2018 12/20 gold book forecasts being 0.1% more than December 2019 12/20 black book.
Overall results:
Fuel Type Results
Sector Results:
The most recent results for the main sectors are as follows:
|
BB Month |
City Car |
Executive |
Lower Medium |
MPV |
Supermini |
SUV |
Upper Medium |
|
12/2019 |
-4.4 |
7.5 |
0.9 |
-3.3 |
-1.6 |
0.7 |
0.2 |
24 month results
Since measurement started our 24 month forecasts have averaged -4.0% less than black book across all vehicle ids, and the most recent results show December 2017 24/40 gold book forecasts being -6.5% less than December 2019 24/40 black book.
Overall results:
Fuel Type results:
Sector results:
The most recent results for the main sectors are as follows:
|
BB Month |
City Car |
Executive |
Lower Medium |
MPV |
Supermini |
SUV |
Upper Medium |
|
12/2019 |
-10.9 |
7.2 |
-7.3 |
-14.9 |
-8.5 |
-6.2 |
-2.8 |
36 month results
Since measurement started our 36 month forecasts have averaged -8.2% less than black book across all vehicle ids, and the most recent results show December 2016 36/60 gold book forecasts being -10.8% less than December 2019 36/60 black book.
Overall results:
Fuel Type results:
Sector results:
The most recent results for these main sectors are as follows:
|
BB Month |
City Car |
Executive |
Lower Medium |
MPV |
Supermini |
SUV |
Upper Medium |
|
12/2019 |
-19.9 |
4.0 |
-7.5 |
-17.6 |
-19.4 |
-7.0 |
-6.7 |
48 month results
Since measurement started our 48 month forecasts have averaged -10.1% less than black book across all vehicle ids, and the most recent results show December 2015 48/80 gold book forecasts being -9.4% less than December 2019 48/80 black book.
Overall results: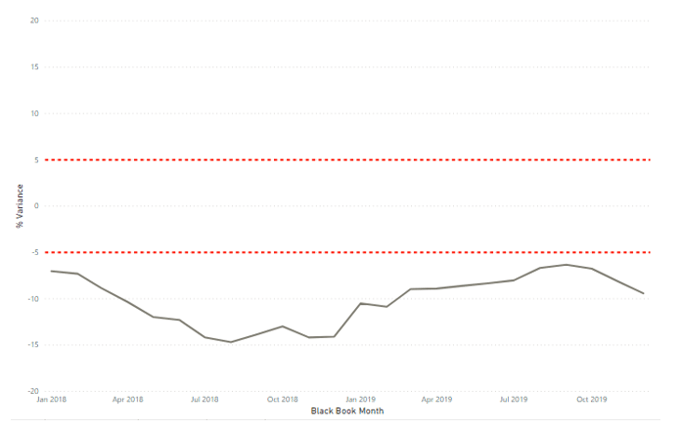
Fuel Type results:
Sector results:
The most recent results for these main sectors are as follows:
|
BB Month |
City Car |
Executive |
Lower Medium |
MPV |
Supermini |
SUV |
Upper Medium |
|
12/2019 |
-11.3 |
3.6 |
-11.2 |
-14.0 |
-15.4 |
-3.9 |
-4.5 |
60 month results
Since measurement started our 60 month forecasts have averaged -6.7% less than black book across all vehicle ids, and the most recent results show December 2014 60/100 gold book forecasts being -6.0% less than December 2019 60/100 black book.
Overall results:
Fuel Type results:
 Sector results
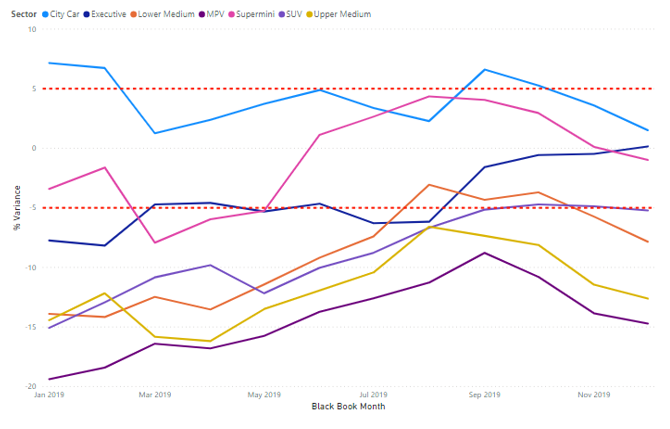
The most recent results for the main sectors are as follows:
|
BB Month |
City Car |
Executive |
Lower Medium |
MPV |
Supermini |
SUV |
Upper Medium |
|
12/2019 |
1.5 |
-0.2 |
-7.8 |
-14.7 |
-1.0 |
-5.2 |
-12.6 |
5. Gold Book Methodology
Overview
All of our future residual values are based on the gold book methodology. Our values take current month black book values as a starting point (uplifted for model changes where necessary), are moved forward according to age/sector/fuel specific year on year deflation assumptions regarding future used car price movements, and are then subjected to additional adjustments by the Editorial Team. Finally, the values are moved forward by the next month’s seasonality adjustments which are differentiated by sector and fuel type and are based on analysis of historical black book movements.
All of these assumptions and adjustments are available for scrutiny to our customers through our gold book iQ product. For years our customers have been asking for transparency in automotive forecasting and we have delivered a ground-breaking product to provide exactly that.
With an increasing number of customers subscribing to gold book iQ, we are entering into a range of debates and discussions around both our overall forecasting methodology and individual elements of the forecasts for particular vehicles. This is expected to evolve over time into a ‘virtuous circle’, with the feedback looping back into the forecast process and delivering continuous improvement. We are embracing a new era of customer communication, with a greatly improved quality of interaction and debate around our forecast values.
Changes may be actioned wherever there is reason to do so outside of the sector reforecast process and we continue our monthly Interproduct analysis with our black book colleagues exactly as before. This has intensified following the availability of our short term forecast data (gold book 0-12, now available to customers), which incorporates detailed exception reporting at a cap hpi ID level and will also be used increasingly going forward to manage the relationships between black book and gold book.
Forecasting Model Development - gold book & iQ
gold book iQ was launched in December 2013 and gives unparalleled transparent insight into the assumptions used to produce our forecasts.
Our short-term forecast product, gold book 0-12, (also marketed as black book +12) was launched shortly afterwards. This is a live, researched product with a dedicated editor and fills a gap in our previous forecast coverage.
Following feedback on our gold book iQ product, from September 2016 we have added more detail into the commentary for each model range reforecast in sector reviews.
In December 2017 we introduced a daily feed of forecasts for new models launched onto the market, so that customers do not have to wait until the next month to receive these forecasts.
Forecast Output
Individual forecasts are provided in pounds and percentage of list price for periods of twelve to sixty months with mileage calculations up to 200,000.
Each forecast is shown in grid format with specific time and mileage bands highlighted for ease of use.
All forecast values include VAT and relate to a cap hpi clean condition and in a desirable colour.
All new car prices in gold book include VAT and delivery.
Parallel Imports
Particular care must be taken when valuing parallel imports. Vehicles are often described as full UK specification when the reality is somewhat different. These vehicles should be inspected to ensure that the vehicle specification is correct for the UK. Parallel imports that are full UK specification and first registered in the UK can be valued the same as a UK-sourced vehicle.
Grey Imports
cap hpi gold book does not include valuations for any grey import vehicles, (i.e. those not available on an official UK price list).
6. Reforecast Calendar 2019/2020:
Monthly Product
Sector 1
Sector 2
Sector 3
Sector 4
Feb-20
Mar-20
Apr-20
May-20
Jun-20
Jul-20
Aug-20
Sep-20
Oct-20
Nov-20
Dec-20
Jan-21
SUV
Upper Medium
MPV
Lower Medium
City Car
SUV
Upper Medium
MPV
Lower Medium
City Car
SUV
Upper Medium
Electric
Executive
Convertible
Sports
Supermini
Electric
Executive
Convertible
Sports
Supermini
Electric
Executive
Large Executive
Coupe Cabriolet
Supercar
Large Executive
Coupe Cabriolet
Supercar
Large Executive
Luxury Executive
Luxury Executive
Luxury Executive

