
Welcome to the third of our new style overviews, previously known as the ‘gold book new car editorials’. Our aim is to bring you improved content and layout, making it easy to identify new and revised information. As always, any customer feedback on this new format would be appreciated: e-mail andrew.mee@cap-hpi.com
The new structure is as follows:
- Headlines - key changes and additions to the overview this month
- Reforecast details this month
- Market conditions
- Historic forecast accuracy
- Forecast methodology
- Sector reforecast schedule 2019-2020
1. Headlines - key changes and additions to the overview this month
Forecast changes
The overall average change in new car forecasts between last month and this month is approximately -2.1% at 36/60, which is slightly more negative than the normal expectation of the seasonal change for full year forecasts between these months, due to the impact of the sectors which have been reforecast.
This month, we publish new reforecasts for the Upper medium, Executive, Large Executive, and Luxury Executive sectors. The overall impact of the changes to forecasts for these sectors at 36/60 is -3.4%.
Details of all values revised by ±5% can be found via the following link: Monthly Reports
See section 2 for more details on forecast changes.
New model ranges added to our forecasts
Bentley Bentayga, Lexus RC-F, Mercedes-Benz AMG GT, Mini Clubman, Porsche Cayenne Coupe, Ssangyong Tivoli and Subaru Forester.
New model ranges to which new derivatives have been added
Audi A3, Audi A6, Audi A7, Citroen C1, Citroen C3 Aircross, Citroen Space Tourer, Fiat 500X, Fiat Doblo, Ford Focus, Ford Kuga, Jaguar XJ, Land Rover Discovery, Land Rover Range Rover Sport, Mazda CX-3, Mercedes-Benz GLA, MG ZS, Nissan X-Trail, Seat Leon, Subaru Levorg, Tesla Model S, Tesla Model X, Toyota C-HR, Toyota Prius, Vauxhall Astra, Vauxhall Corsa, Vauxhall Mokka and Volkswagen Touran.
Market Conditions Changes
The Brexit outcome remains unknown. Although there is a slim chance that we could leave the EU on 22nd May if Theresa May’s deal is approved by parliament, it is more likely that if we leave, it will be on the new deadline of the end of October under the terms of a revised deal. The impact on the car market therefore remains unknown.
SMMT figures show UK new car registrations up to the end of March 2019 were down -2.4% against 2018, with diesel down -20.3%; broadly in line with our expectations.
The used car market remains strong, but as we predicted, the previously excessive strength of petrol and hybrid cars continues to decline, and our forecasts assume that this will continue through 2019. Diesel values continue to hold up well, and our forecasts assume that this too will continue.
See section 3 for more details on market conditions changes.
Historic Forecast Accuracy Changes
We continue to see a gradual improvement in historic petrol forecast accuracy, as the previous strength in current market values for petrol, is continuing to diminish as we predicted. In addition, our sector reforecasts since early 2017 have taken this strength into account, and this will flow into future accuracy results, starting with 12 month forecasts.
See section 4 for more details on accuracy.
2. Forecast details this month:
This month, we publish our new reforecasts for the Upper Medium, Executive, Large Executive, and Luxury Executive sectors.
The overall impact of the changes at 36/60, split by sector and fuel type, is as follows:
|
SECTOR |
UNDERLYING FORECAST CHANGE |
SEASONAL ELEMENT |
OBSERVED CHANGE APRIL to MAY |
|
Upper Medium Petrol Upper Medium Diesel Executive Petrol Executive Diesel Large Executive Petrol Large Executive Diesel Luxury Executive Petrol |
-0.8% -2.3% -4.3% -3.4% -1.5% -0.9% -0.4% |
-1.3% -1.5% -0.8% -1.2% -1.4% -1.1% -0.8% |
-2.1% -3.8% -5.1% -4.6% -2.9% -2.0% -1.2% |
We have not revised our future market deflation assumptions for these sectors, but we are likely to review them in the next reforecasts in 5 months’ time.
The changes to underlying forecasts therefore reflect the movement in current values (black book) since the last reforecast 5 months ago.
For Upper Medium Diesel, and in particular for Executive Petrol and Diesel, the current values have fallen by significantly more than normal seasonal expectation over these five months, and this is reflected in the new forecasts.
The tables below summarise the 36/60 forecast changes for all the reforecast sectors since the middle of 2017, when petrol strength became apparent. It can be seen that in general the underlying forecast changes this month are little more negative than those over the past two years, reflecting the hardening of the market.
|
Book Month |
Sector |
Underlying Forecast Change |
Seasonal element |
Observed Change vs previous month |
|
Dec-18 |
Upper Medium Petrol |
-0.2 |
-2.0 |
-2.2 |
|
Dec-18 |
Upper Medium Diesel |
-0.4 |
-2.0 |
-2.4 |
|
Jul-18 |
Upper Medium Petrol |
1.5 |
-0.7 |
0.8 |
|
Jul-18 |
Upper Medium Diesel |
-0.7 |
-0.8 |
-1.5 |
|
Feb-18 |
Upper Medium Petrol |
-0.1 |
0.0 |
-0.1 |
|
Feb-18 |
Upper Medium Diesel |
-1.2 |
0.0 |
-1.2 |
|
Sep-17 |
Upper Medium Petrol |
2.5 |
3.2 |
5.7 |
|
Sep-17 |
Upper Medium Diesel |
-0.7 |
3.5 |
2.8 |
|
Book Month |
Sector |
Underlying Forecast Change |
Seasonal element |
Observed Change vs previous month |
|
Dec-18 |
Executive Petrol |
-0.8 |
-1.4 |
-2.2 |
|
Dec-18 |
Executive Diesel |
-1.2 |
-1.5 |
-2.7 |
|
Jul-18 |
Executive Petrol |
2.2 |
-1.7 |
0.5 |
|
Jul-18 |
Executive Diesel |
-3.5 |
-1.0 |
-4.5 |
|
Feb-18 |
Executive Petrol |
-0.1 |
0.0 |
-0.1 |
|
Feb-18 |
Executive Diesel |
-3.6 |
0.0 |
-3.6 |
|
Sep-17 |
Executive Petrol |
2.3 |
2.8 |
5.1 |
|
Sep-17 |
Executive Diesel |
1.2 |
3.1 |
4.3 |
|
Book Month |
Sector |
Underlying Forecast Change |
Seasonal element |
Observed Change vs previous month |
|
Dec-18 |
Large Executive Petrol |
1.5 |
-1.4 |
0.1 |
|
Dec-18 |
Large Executive Diesel |
0.8 |
-1.8 |
-1.0 |
|
Jul-18 |
Large Executive Petrol |
0.2 |
-1.7 |
-1.5 |
|
Jul-18 |
Large Executive Diesel |
-3.0 |
-1.2 |
-4.2 |
|
Feb-18 |
Large Executive Petrol |
-0.1 |
0.0 |
-0.1 |
|
Book Month |
Sector |
Underlying Forecast Change |
Seasonal element |
Observed Change vs previous month |
|
Dec-18 |
Luxury Executive Petrol |
0.4 |
-1.9 |
-1.5 |
|
Jul-18 |
Luxury Executive Petrol |
-1.3 |
-1.1 |
-2.4 |
|
Feb-18 |
Luxury Executive Petrol |
-1.5 |
0.0 |
-1.5 |
|
Sep-17 |
Luxury Executive Petrol |
1.5 |
3.1 |
4.6 |
As part of the sector reforecasts published this month, we have also reviewed and amended walk-ups on the following models, to align them to the latest black book research. Many of these changes were to a significant number of walk-ups, some of which were positive and some negative, so it is not possible to list all the detail within this document.
|
Sector |
Generation |
Comment |
|
Luxury Executive |
ASTON MARTIN RAPIDE (10- ) |
Full walk up realignment |
|
Upper Medium |
AUDI A4 (18- ) |
Black Edition trim increase |
|
Upper Medium |
AUDI A4 (18- ) DIESEL |
Black Edition trim increase |
|
Upper Medium |
BMW 3 SERIES GT (13- ) DIESEL |
Full engine walk up realignment |
|
Upper Medium |
BMW 4 SERIES GRAN COUPE (14- ) DIESEL |
Full engine walk up realignment |
|
Executive |
BMW 5 SERIES (16- ) DIESEL |
Full engine walk up realignment |
|
Upper Medium |
JAGUAR XE (14- ) |
Full engine walk up realignment |
|
Executive |
JAGUAR XF (15- ) DIESEL |
Sportbrake body syle increased |
|
Upper Medium |
KIA STINGER GRAN TURISMO (17- ) |
3.3 T-GDi [365] walk up reduced |
|
Upper Medium |
LEXUS IS (13- ) HYBRID |
Full walk up realignment |
|
Upper Medium |
LEXUS IS (18- ) HYBRID |
Full walk up realignment |
|
Large Executive |
LEXUS LS (17- ) HYBRID |
Full walk up realignment |
|
Large Executive |
MERC S CLASS (13- ) |
Full walk up realignment |
|
Large Executive |
MERC S CLASS (13- ) DIESEL |
SE and SE Line trims decreased |
|
Large Executive |
PORSCHE PANAMERA (16- ) HYBRID |
4.0 V8 [680] walk-up increased |
|
Luxury Executive |
ROLLS-ROYCE GHOST (17- ) |
Full walk up realignment |
|
Luxury Executive |
ROLLS-ROYCE PHANTOM (03- ) |
Full walk up realignment |
|
Luxury Executive |
ROLLS-ROYCE WRAITH (13- ) |
Black Badge trim increased |
|
Executive |
VOLVO S90/V90 (16- ) DIESEL |
2.0 D5 Powerpulse [235] decreased |
Other forecast changes this month (in addition to sector reforecasts)
Mazda 2 petrol:
Walkup change on automatic variants, to align with latest black book research, resulting in increased forecasts.
Mini Countryman diesel:
Reforecast to correct a future deflation assumption oversight which treated this range less favourably than similar size competitors, resulting in increased forecasts.
Seasonality changes
In line with our gold book methodology, all other model ranges which are outside of the sector reforecasts and outside of the other changes listed above, have had their forecasts moved forward from month to month by seasonal factors which are differentiated by sector and fuel type and are based on analysis of historical black book movements.
3. Market Overview
The economy
The Brexit outcome remains unknown. Although there is a slim chance that we could leave the EU on 22nd May if Theresa May’s deal is approved by parliament, it is more likely that if we leave, it will be on the new deadline of the end of October under the terms of a revised deal. The impact on the car market therefore remains unknown.
Therefore we are still planning to conform to our original timetable of sector reforecasts and do not consider it necessary to embark on a concurrent reforecast of every sector at the same time. We will of course continue to monitor the situation very closely.
It is worth noting that even under a scenario where new car prices may increase, and new car supply may be disrupted for a period, this could have a positive impact on used car values, which would only be offset if the UK were to go into long term recession.
Despite uncertainty over Brexit, the outlook for the UK economy remains unchanged. The latest independent economic forecasts were published by HM Treasury in February, and these still do not forecast a recession, so remain in line with our own view. Compared with the previous November forecasts, the only significant change was a reduction in the average GDP forecast for 2019.
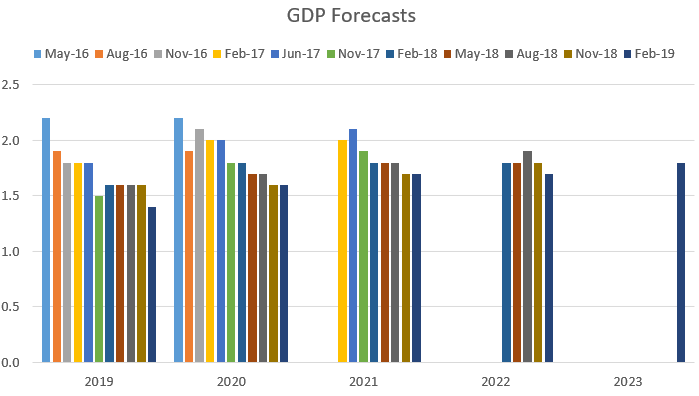
These forecasts are consistent with the recent history of GDP growth. Figures from ONS show that GDP grew by 0.4% in the three months to October, slower than the 0.6% in the three months to September (which had been better than expected). These figures are broadly in line with the trend in quarterly growth since 2016, with the UK economy continuing a trajectory of consistent but sluggish growth.
Not all ages and sectors of vehicle are directly impacted by GDP, but for those that are then in some cases lower future registration volumes will offset reduced GDP.
CPI is currently running at 1.8% (March 2019); and the average of the latest independent forecasts (February 2019) are for it to remain around 2% over the next 5 years.
Unemployment is currently running at 3.9% (March 2019); and the average of the latest independent forecasts (February 2019) are for it to remain around 4% over the next 5 years.
Interest rates are expected to remain low for the medium term. Any significant further increase in base rate still seem unlikely until there is a combination of further improvements in wage growth and increases in rates of headline inflation.
Wage growth remains reasonably healthy, although slow by historical standards, and price inflation is now more stable, so these conditions should continue to provide a positive impetus to the overall economy.
Oil prices seem to have stabilised following following the recent decision by OPEC and others to curb output..
Forecasts for future house price increases vary dramatically by sector and especially by geography. Despite a view expressed by the Bank of England’s Financial Stability Committee that the buy to let sector could “amplify” any boom or bust in the housing market, any negative effects are likely to be centred on London, with the rest of the country significantly more insulated from the impact of any such downturn.
Supply Outlook
Exchange rates are a major influence on the profitability of the UK new car market and they strongly influence eventual used vehicle volumes. Sterling rates against the Euro reduced from around 1.43 in late 2015 to around 1.14 by late 2017, where they have broadly remained. This has limited manufacturers’ scope for heavy discounting and forced registration activity in the UK.
New car registrations in other key European markets continue to grow because of the release of pent up demand, allowing manufacturers to divert volume to these markets. In the three years before the financial crisis, France, Germany, Italy and Spain represented an annual combined volume of almost 9.4 million units. They have recovered to 7.7 million in 2015, 8.3M in 2016, 8.7M in 2017 and 8.85M in 2018, suggesting there is still further growth to come, despite a contracting market in Italy and sluggish growth in Germany.
As a result of the exchange rate position and the capacity of other markets, UK new car registrations for 2017 reflected a ‘true market’ and came in at 2.54M compared with 2016’s 2.69 million (down -5.7%), Most of that fall came from diesel registrations (down -17.1%) as a result of ongoing bad press about air pollution.
2018 registrations finished at -6.8% less than 2017, the further fall being due in part to the production and delivery issues caused by WLTP changes; and diesel registrations were down -29.6% compared with 2017, resulting in 31.7% market share, with most of the volume shift still being into petrol cars.
Looking to the next few years, and subject to the outcome of Brexit, we expect the total UK market to stabilise, with 2019 volume similar to but probably less than 2018, and with some growth in the outer years if GDP forecasts materialise and exchange rates remain relatively stable. The shift out of diesel will continue, but the rate of decline will slow down as we reach the hard core of drivers for whom diesel makes sense, and there could be return to diesel from some drivers who switched to petrol but have not liked the increase in fuel costs. There should be increased take-up of alternative fuelled vehicles but this is very dependent on taxation incentives and charging infrastructure. Petrol will remain the dominant fuel type.
Demand outlook and impact on future used values
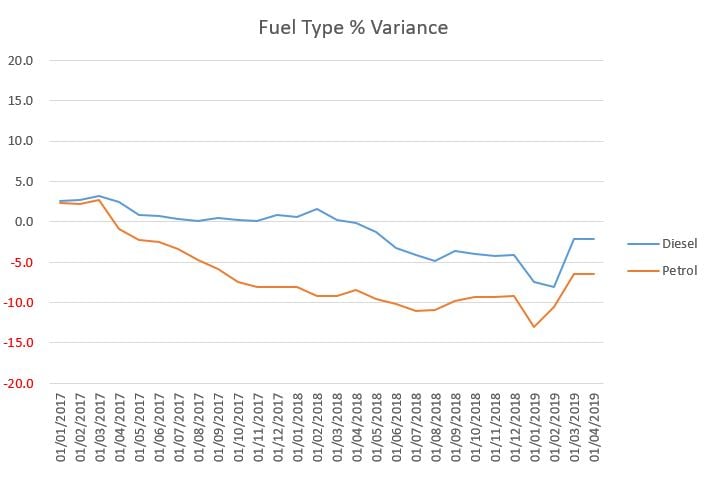
Contrary to the new car market where diesel share has declined sharply, used diesel values have continued to hold up well (broadly in line with our historic future deflation assumptions) as demand has continued to meet supply
Petrol and hybrid values were particularly strong (exceeding our historic future deflation assumptions) up to late 2018, as buyers sought an alternative to diesel where available. We always considered this strength to be unsustainable, and there is now clear evidence that the petrol and hybrid market is starting to cool as these cars look too expensive and used supply of these fuel types starts to increase.
In late 2018, diesel values strengthened a little as WLTP affected the number of part exchanges coming onto the market, and fleets held onto cars while they await Brexit developments. We expect this strength to ease as 2019 progresses.
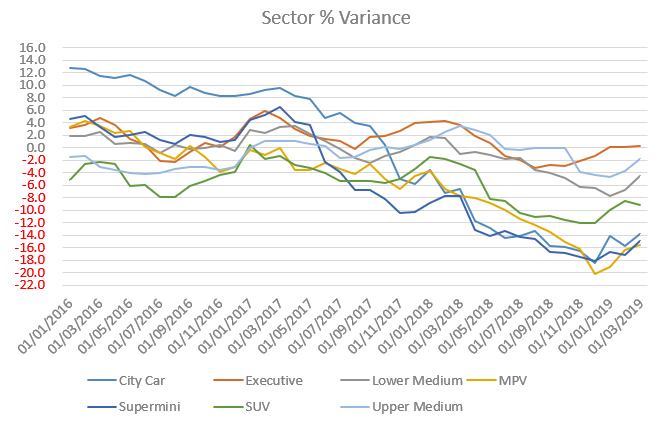
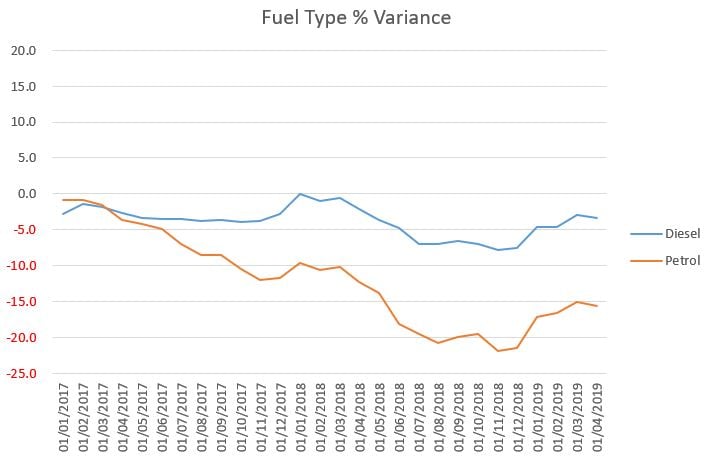
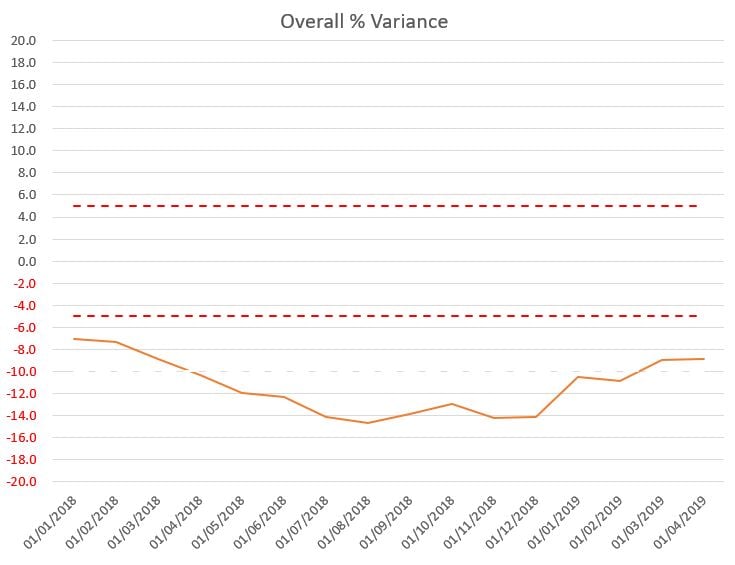
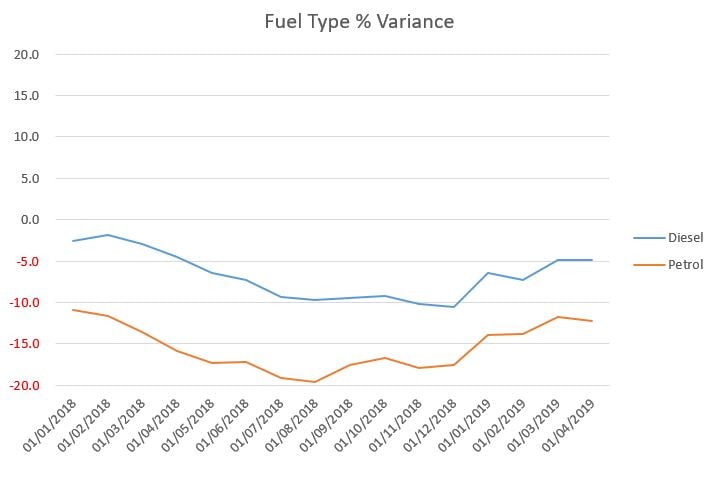
The following chart shows the average year-on-year change in value of the same model (cap id) at 36/60k, split by fuel type.
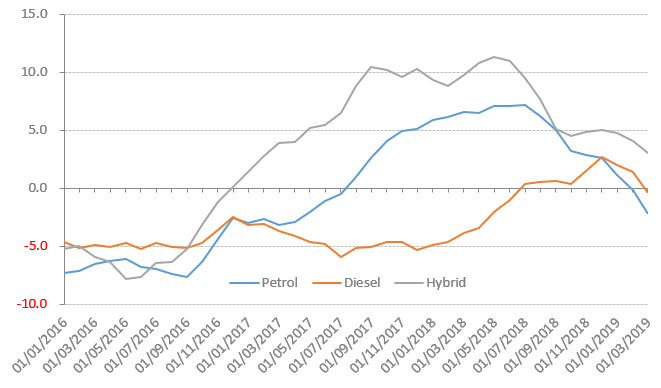
In the main vehicle sectors, petrol values have shown the same trends of growing strength since early 2017, and declining strength since mid-2018. These trends are the mirror image of our petrol forecast accuracy results (see section 4).
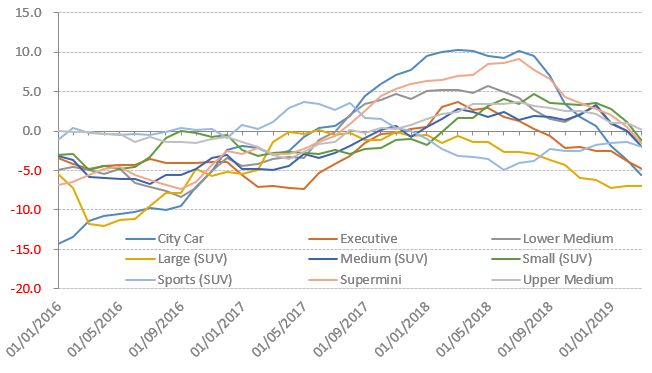
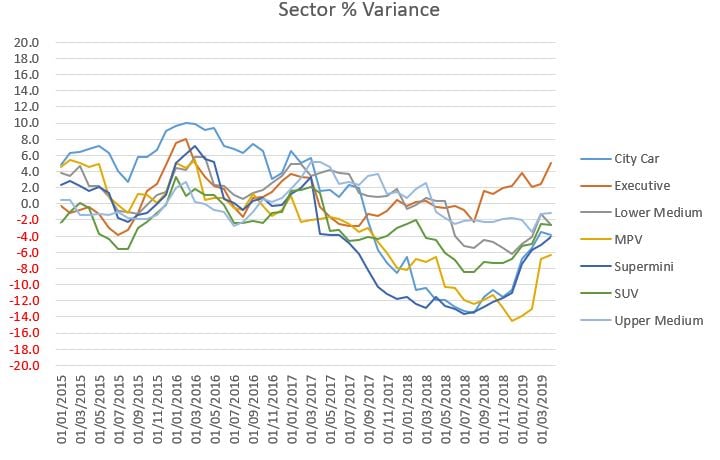
It is worth noting that City Car, recently the strongest sector, has now moved into deflation, consistent with our forecasting assumption, and we expect the other sectors will follow the same path as we go through 2019.
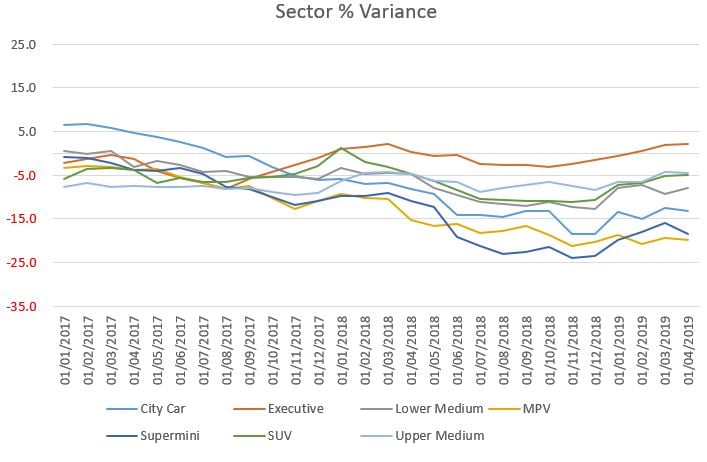
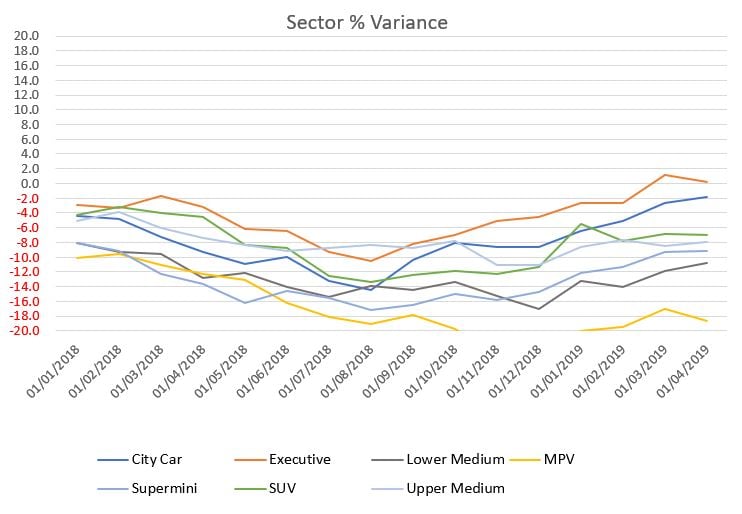
The following chart shoes the average year-on-year change in value of the same model (cap id) at 36/60k, split by sector, for petrol cars.
Looking to the next few years, we expect the supply/demand equation to re-stabilise across all fuel types, subject to the outcome of Brexit. Our forecast assumptions are for year-on year deflation broadly in the range of -3% to -6% per annum, varying by sector and fuel type.
There will be an increase in supply of used diesel cars coming onto the market until 2020, as a result higher registration volumes up until 2017. However we expect demand will meet this supply, unless there is widespread implementation of city charging zones for diesel cars in this period, or significant government legislation changes affecting the running costs of diesel cars. We do not consider either of these actions to be likely.
4. Historic Forecast Accuracy:
Since the introduction of gold book at the end of 2013, we have been able to track the accuracy of historic forecasts against current (black book) values. This tracking is longest for 12 month forecasts (tracked since January 2015) and shortest for 60 month forecasts (tracked since January 2019).
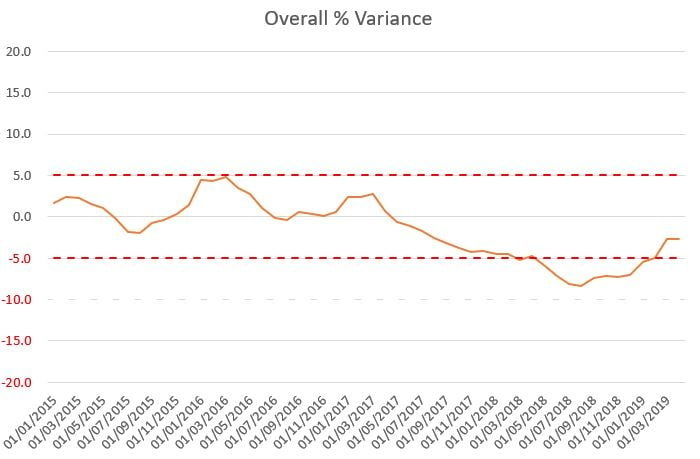
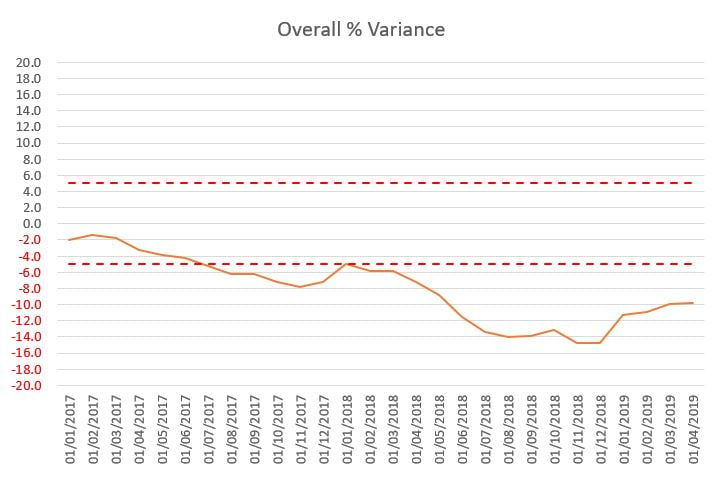
Overall we are satisfied that accuracy results are generally been within the +/- 5% target agreed with customers, but recognise that results have been affected by the unexpected strength of petrol values which started in 2017 as a result of anti-diesel press. Diesel forecast accuracy has generally been within target, while petrol forecast accuracy has fallen outside of target since 2017.
We have always stated that the strength of petrol values was unsustainable, and although the strength lasted a little longer than we expected, it is now falling away as used petrol volumes increase.
Our historic forecast accuracy is now starting to improve as a result of this market correction of petrol values, and also as a result of historic sector reforecasts that took petrol strength into account now starting to flow through in to the accuracy results. This flow is happening first with 12 month forecasts, then with 24 month forecasts, etc.
Therefore the tracking charts below all show the same general pattern of returning to improving results, with the difference to target being less for 12 month forecasts (reforecast most recently); and being more for longer term forecasts (reforecast less recently).
City Car forecast accuracy, followed by Supermini, have been most volatile over the long term, partly as a result of variable manufacturer behaviour regarding forced registrations, and partly because their low pound values results in relatively large percentage figures.
More recently, MPV forecast accuracy has been affected by the strength in values due to demand outstripping supply; but sector reforecasts have taken this into account, and will flow through into improved results in the future.
12 month results
Since measurement started our 12 month forecasts have averaged -1.5% less than black book across all vehicle ids, and the most recent results show April 2018 12/20 gold book forecasts being -2.7% less than April 2019 12/20 black book.
The most recent results for these main sectors are as follows:
|
BB Month |
City Car |
Executive |
Lower Medium |
MPV |
Supermini |
SUV |
Upper Medium |
|
01/04/2019 |
-3.9 |
5.1 |
-2.6 |
-6.4 |
-4.1 |
-2.6 |
-1.2 |
24 month results
Since measurement started our 24 month forecasts have averaged -3.5% less than black book across all vehicle ids, and the most recent results show April 2017 24/40 gold book forecasts being -8.3% less than April 2019 24/40 black book.
 The most recent results for these main sectors are as follows:
|
BB Month |
City Car |
Executive |
Lower Medium |
MPV |
Supermini |
SUV |
Upper Medium |
|
01/04/2019 |
-12.9 |
0.2 |
-3.1 |
-15.9 |
-12.6 |
-9.1 |
-5.6 |
36 month results
Since measurement started our 36 month forecasts have averaged -8.1% less than black book across all vehicle ids, and the most recent results show April 2016 36/60 gold book forecasts being -9.9% less than April 2019 36/60 black book.
The most recent results for these main sectors are as follows:
|
BB Month |
City Car |
Executive |
Lower Medium |
MPV |
Supermini |
SUV |
Upper Medium |
|
01/04/2019 |
-13.2 |
2.2 |
-7.9 |
-19.8 |
-18.6 |
-4.8 |
-4.6 |
48 month results
Since measurement started our 48 month forecasts have averaged -11.3% less than black book across all vehicle ids, and the most recent results show April 2015 48/80 gold book forecasts being -8.9% less than April 2019 48/80 black book.
 The most recent results for these main sectors are as follows:
|
BB Month |
City Car |
Executive |
Lower Medium |
MPV |
Supermini |
SUV |
Upper Medium |
|
01/04/2019 |
-1.8 |
0.2 |
-10.9 |
-18.7 |
-9.2 |
-7.1 |
-8.0 |
60 month results
This month we have our fourth set of results for 60 month forecasts, and these average -10.0% less than April 2019 black book values, similar to our 48 month results.
We will provide further analysis and trending as we move through 2019.
5. Gold Book Methodology
Overview
All of our future residual values are based on the gold book methodology. Our values take current month black book values as a starting point (uplifted for model changes where necessary), are moved forward according to age/sector/fuel specific year on year deflation assumptions regarding future used car price movements, and are then subjected to additional adjustments by the Editorial Team. Finally, the values are moved forward by the next month’s seasonality adjustments which are differentiated by sector and fuel type and are based on analysis of historical black book movements.
All of these assumptions and adjustments are available for scrutiny to our customers through our gold book iQ product. For years our customers have been asking for transparency in automotive forecasting and we have delivered a ground-breaking product to provide exactly that.
With an increasing number of customers subscribing to gold book iQ, we are entering into a range of debates and discussions around both our overall forecasting methodology and individual elements of the forecasts for particular vehicles. This is expected to evolve over time into a ‘virtuous circle’, with the feedback looping back into the forecast process and delivering continuous improvement. We are embracing a new era of customer communication, with a greatly improved quality of interaction and debate around our forecast values.
Changes may be actioned wherever there is reason to do so outside of the sector reforecast process and we continue our monthly Interproduct analysis with our black book colleagues exactly as before. This has intensified following the availability of our short term forecast data (gold book 0-12, now available to customers), which incorporates detailed exception reporting at a cap hpi ID level and will also be used increasingly going forward to manage the relationships between black book and gold book.
Forecasting Model Development - gold book & iQ
gold book iQ was launched in December 2013 and gives unparalleled transparent insight into the assumptions used to produce our forecasts.
Our short-term forecast product, gold book 0-12, (also marketed as black book +12) was launched shortly afterwards. This is a live, researched product with a dedicated editor and fills a gap in our previous forecast coverage.
Following feedback on our gold book iQ product, from September 2016 we have added more detail into the commentary for each model range reforecast in sector reviews.
In December 2017 we introduced a daily feed of forecasts for new models launched onto the market, so that customers do not have to wait until the next month to receive these forecasts.
Forecast Output
Individual forecasts are provided in pounds and percentage of list price for periods of twelve to sixty months with mileage calculations up to 200,000.
Each forecast is shown in grid format with specific time and mileage bands highlighted for ease of use.
All forecast values include VAT and relate to a cap hpi clean condition and in a desirable colour.
All new car prices in gold book include VAT and delivery.
Parallel Imports
Particular care must be taken when valuing parallel imports. Vehicles are often described as full UK specification when the reality is somewhat different. These vehicles should be inspected to ensure that the vehicle specification is correct for the UK. Parallel imports that are full UK specification and first registered in the UK can be valued the same as a UK-sourced vehicle.
Grey Imports
cap hpi gold book does not include valuations for any grey import vehicles, (i.e. those not available on an official UK price list).
6. Reforecast Calendar 2019/2020:
Monthly Product
Sector 1
Sector 2
Sector 3
Sector 4
June-19
Jul-19
Aug-19
Sep-19
Oct-19
Nov-19
Dec-19
Jan-20
Feb-20
Mar-20
Apr-20
May-20
MPV
Lower Medium
City Car
SUV
Upper Medium
MPV
Lower Medium
City Car
SUV
Upper Medium
MPV
Lower Medium
Convertible
Sports
Supermini
Electric
Executive
Convertible
Sports
Supermini
Electric
Executive
Convertible
Sports
Coupe Cabriolet
Supercar
Large Executive
Coupe Cabriolet
Supercar
Large Executive
Coupe Cabriolet
Supercar
Luxury Executive
Luxury Executive

