
The Christmas holiday slowdown in the used LCV Wholesale Market began earlier than expected with auction sale attendances noticeably lower from the middle of November which continued for the remainder of the month and throughout December.
Our first impressions as we travelled around the country attending auctions was that it was so much easier to find parking spaces which is usually a reliable indication that attendance levels are likely to be down. Whilst that generally seemed to be the case at most of the sales there were still a fair number of professional buyers around, however, many of them seemed to be on a watching brief and bidding activity from them was decidedly slower than we had seen in previous weeks. Auctioneers struggled to gain realistic opening bids in the halls and we often sensed their frustration as they failed to build any kind of momentum with their calls for bids. As the sales progressed, increasingly, it was the online buyers who came in first and for some lots it seemed like an internet only sale with the hall buyers passively observing the action on the display screens.
Actual monthly trade sales for December were down by just under 15% compared to November which supports our observations at the auctions. This figure takes into account the effect of the Christmas holidays, so it does represent a true decline in sales.
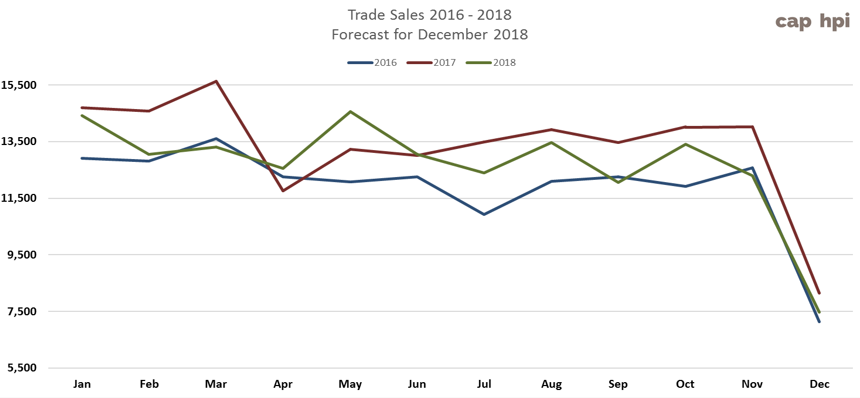
The trade sales forecast chart below, which tracks actual trade sales from a wide range of remarketing routes including auctions, supports our sentiments too. Clearly it shows 2017 was a much better year overall but it also shows that sales volumes increased at the beginning of Quarter 4 in both 2016 and 2017. It’s a completely different picture at the beginning of Quarter 4 2018 as there was marked decline in sales from October to November completely bucking the trends we had previously seen. That said, our latest forecast for December suggests that trade sales will end up only marginally above those seen in 2016 but well below the 2017 level.
Supply Trend: Auction Catalogue Entries
Jan-18
Feb-18
Mar-18
Apr-18
May-18
Jun-18
Jul-18
Aug-18
Sep-18
Oct-18
Nov-18
Dec-18
Auction Entries % Var
2%
6%
-16%
-9%
25%
-3%
3.60%
0%
-14%
8%
3.5%
23%
Re-Entries
19.90%
24.25%
21.74%
19.00%
22.96%
27.65%
31.18%
30.37%
24.52%
24.51%
26.64%
29.83%
New Entries
80.10%
75.75%
78.26%
81.00%
77.04%
72.35%
68.82%
69.63%
75.48%
75.49%
73.36%
70.17%
Average age (Months)
59
60
61
64
63
61
60
61
61
60
63
63
Average Mileage
72,318
74,589
75,676
76,127
75,780
74,631
76,993
76,087
74,994
75,074
78,883
78,312
From a supply perspective, analysis of the auction sale catalogues revealed that December auction entries were down by 23%. On average we would normally expect around 75% of these to be first time entries with re-entries making up the other 25%. In December the split was in the order of 70%/30%, as the proportion of re-entries were up by almost 5%. The average age of vehicles remained the same as last month at 63 months whilst the average recorded mileage decreased slightly from 78,883 to 78,312.
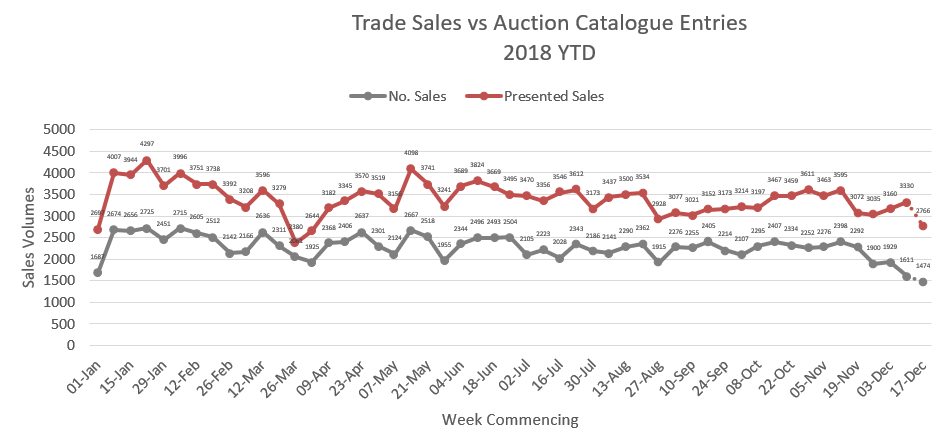
As the above chart shows, certainly from mid-November up until the third week in December, auction entries were increased week on week whilst actual sales were decreasing.
As we look forward to 2019, are we currently witnessing seasonality factors at play and will the market bounce back in January? Is there such a thing as seasonality anymore or is this the start of a long-term trend that’s likely to affect the used LCV market for many months ahead?
From the conversations we’ve had both internally and externally with various industry stakeholders the truth is nobody really knows. However, the usual hot topics such as used stock levels, model mix, impending large de-fleets, quality, and retail demand somehow seem to pale into significance when compared to the wider socio-economic and political issues the UK currently faces.
Like many other commentators we often talk about the effects on the market of economic and political uncertainty. Whilst these are vague concepts, there can be little doubt that certain events do have a direct impact on the used LCV market, particularly on retail demand, trade demand and market prices. For example, the historic trade sales forecast clearly shows the impact of the EU Referendum and the General Election on trade sales volumes. There are probably as many competing theories over why as there are budding armchair economists, but more to the point, for both events the recorded number of trade sales were down significantly.
What is abundantly clear as we publish our January guide values, in terms of political and economic uncertainty, it doesn’t get any worse than what we all witnessed during December. Therefore, we believe the question should not be about will there be a downturn in the market, but rather, what will be the extent of the downturn and how long will it take for the market to recover?
Sales Performance by Sector
October 2018
November 2018
December 2018
LCV Sector
Market Share
Performance
Market Share
Performance
Market Share
Performance
City Van
3.77%
99.61%
5.27%
98.46%
5.20%
99.08%
Small Van
24.40%
100.98%
22.97%
100.87%
22.72%
99.86%
Medium Van
28.53%
100.13%
29.74%
100.34%
30.39%
100.14%
Large Van
18.05%
98.47%
18.89%
98.19%
17.77%
98.55%
Over 3.5T
0.20%
106.51%
0.33%
100.43%
0.33%
99.83%
4x4 Pick-up Workhorse
3.07%
100.06%
2.51%
98.02%
2.70%
98.64%
4x4 Pick-up Lifestyle SUV
12.85%
100.54%
11.47%
100.82%
12.49%
99.29%
Forward Control Vehicle
0.21%
98.27%
0.17%
97.72%
0.38%
94.63%
Chassis - Derived
6.80%
98.76%
5.47%
96.90%
5.62%
96.71%
Mini-bus
0.34%
105.41%
0.80%
102.04%
0.51%
94.15%
Vat Qualifying
1.52%
99.27%
2.09%
96.78%
1.58%
99.27%
Total Market
100.00%
99.98%
100.00%
99.70%
100.00%
99.34%
For the second month in succession there have been some significant downward shifts in the market prices across all sectors which have been reflected in this month’s published guide prices. All but the City Van and Small Van sectors, have had substantial downward guide price movements. Considering the relatively high average cost of 4x4 Pick Ups and their usual susceptibility to market forces, both the Workhorse and Lifestyle sectors have fared relatively better than expected.
|
January: LCV Used Guide Price Movements 3 year / 60k |
||
|
LCV Sector |
Average % Movement |
Average £ Movement |
|
City Van |
-0.8% |
-£28 |
|
Small Van |
-0.5% |
-£28 |
|
Medium Van |
-1.6% |
-£169 |
|
Large Van |
-2.1% |
-£183 |
|
Over 3.5T |
-1.8% |
-£202 |
|
4x4 Pick-up Workhorse |
-0.3% |
-£34 |
|
4x4 Pick-up Lifestyle SUV |
-0.6% |
-£70 |
|
Forward Control Vehicle |
-1.2% |
-£139 |
|
Chassis - Derived |
-1.3% |
-£128 |
|
Mini-bus |
-4.1% |
-£460 |
|
Vat Qualifying |
-0.4% |
-£51 |
Updated - Vehicle Colour/Price Guide
Whilst auction catalogue entries always specify colour, it’s the guide values of White vans that you will see printed in the auction catalogues.
Every month in this editorial we remind our subscribers that the published guide values are for standard vehicles in plain white as they appear in the vehicle manufacturer’s price lists.
It’s widely accepted within the remarketing industry that age, mileage and condition aren’t the only factors that can affect how much a used vehicle is worth, colour is extremely important too. Whilst traditionally there have been fewer standard colours to choose from when buying a commercial vehicle, over recent years that’s changed as vehicle manufacturers have responded to a growing demand for vehicles in a much greater range of colours. Some manufacturer’s will also supply vehicles factory-painted in corporate colours to fulfil certain large fleet orders adding even more colours into the mix of vehicles which eventually come back into the used LCV market.
Whilst white remains the colour choice for most new LCV buyers, increasingly we are seeing more and more vans in other colours entering the used market. The chart below is intended as a guide to illustrate how more or less in percentage terms you would expect to pay for a vehicle in any of the colours listed. For example, if you were bidding on a Silver van in the City Van sector you can expect to pay on average 1.80% more than you’d pay for the same van in White. The values shown in this table are based on actual trade sales of vehicles at open auctions and that at any given time the market values of vehicles are dependent on many other factors such as supply volume and condition.
|
Colours |
City Van |
Small Van |
Medium Van |
Large Van |
4x4 Workhorse |
4x4 Lifestyle |
Mini-bus |
VAT Qualifying |
|
White |
cap Average |
cap Average |
cap Average |
cap Average |
cap Average |
cap Average |
cap Average |
cap Average |
|
Silver |
1.88% |
3.48% |
2.60% |
4.58% |
1.95% |
1.02% |
-0.94% |
1.81% |
|
Blue |
-0.19% |
0.44% |
2.61% |
1.04% |
1.38% |
1.08% |
-2.46% |
1.73% |
|
Black |
3.64% |
4.44% |
3.68% |
3.39% |
2.19% |
0.99% |
3.96% |
|
|
Grey |
4.85% |
5.74% |
4.34% |
3.53% |
2.78% |
1.38% |
4.50% |
|
|
Red |
0.71% |
-0.51% |
1.62% |
-1.32% |
1.63% |
0.31% |
2.43% |
|
|
Yellow |
-4.23% |
-4.24% |
-6.32% |
-7.72% |
||||
|
Green |
-0.45% |
-3.98% |
-2.88% |
-2.37% |
2.10% |
0.79% |
5.15% |
|
|
Orange |
0.26% |
8.60% |
0.79% |
1.64% |
||||
|
Brown |
1.17% |
1.95% |
-0.94% |
Top 10 models driving the used LCV Market
The Top 10 tables below give you a clear picture of the makes and models in the main LCV sectors that are driving prices in the used LCV Market. Arranged in order of their respective share of total sector sales, the percentage CAP performance is based on actual recorded sales at open auctions.
Since our guide values reflect the market prices of basic vans in plain white as they appear in the vehicle manufacturer’s price lists, some of guide price movements you might see in this edition may not correlate directly with the sales performances shown in the tables since these include vehicles in all colours and specifications.
|
CAPId |
City Van |
Sector Share |
%CAP |
%CAP White Only Condition Adjusted |
|||
|
11121 |
CORSAVAN DIESEL – 1.3 CDTi 16V Van |
19.74% |
95.7% |
99.1% |
|||
|
26324 |
FIESTA DIESEL – 1.5 TDCi Van |
13.16% |
101.6% |
102.3% |
|||
|
34795 |
BIPPER DIESEL – 1.3 Hdi 75 Professional [Nav] [non Start/Stop] |
4.47% |
105.3% |
100.4% |
|||
|
24217 |
NEMO DIESEL – 1.3 Hdi Enterprise [non Start/Stop] |
3.68% |
90.9% |
99.5% |
|||
|
30871 |
TRANSIT COURIER DIESEL – 1.5 TDCi Trend Van |
3.42% |
104.5% |
95.1% |
|||
|
30869 |
TRANSIT COURIER DIESEL – 1.5 TDCi Van |
3.16% |
93.5% |
94.5% |
|||
|
26328 |
FIESTA DIESEL – 1.6 TDCi Sport Van |
2.89% |
108.2% |
106.5% |
|||
|
24233 |
BIPPER DIESEL – 1.3 Hdi 75 Professional [non Start/Stop] |
2.63% |
99.3% |
104.0% |
|||
|
24228 |
BIPPER DIESEL – 1.3 Hdi 75 S [non Start/Stop] |
2.63% |
87.5% |
100.2% |
|||
|
24216 |
NEMO DIESEL – 1.3 Hdi LX [non Start/Stop] |
2.11% |
101.5% |
105.2% |
|||
|
Sales in this sector were down by just over 17% whilst the average sales performance was around 1% below the guide price. A downward adjustment of 1% has been applied to the January guide values for most model ranges in this sector with the following notable exceptions…
|
|||||||
CAPId
Small Van
Sector Share
%CAP
%CAP White Only Condition Adjusted
18445
BERLINGO L1 DIESEL - 1.6 HDi 625Kg Enterprise 75ps
10.67%
103.4%
103.1%
26630
KANGOO DIESEL - ML19dCi 75 eco2 Van
4.40%
99.3%
99.3%
24234
COMBO L1 DIESEL - 2000 1.3 CDTI 16V H1 Van
2.93%
92.6%
98.4%
24235
COMBO L1 DIESEL - 2000 1.3 CDTI 16V ecoFLEX H1 Van
2.60%
96.6%
95.6%
26689
TRANSIT CONNECT 200 L1 DIESEL - 1.6 TDCi 115ps Limited Van
2.60%
97.6%
103.2%
22432
PARTNER L1 DIESEL - 850 S 1.6 HDi 92 Van [SLD]
2.53%
97.1%
95.0%
15182
BERLINGO L1 DIESEL - 1.6 HDi 625Kg LX 75ps
2.07%
105.6%
101.8%
11465
COMBO DIESEL - 2000 1.3CDTi 16V Van [75PS]
2.00%
89.6%
94.3%
16514
TRANSIT CONNECT 230 LWB DIESEL - High Roof Van TDCi 90ps
1.87%
90.5%
97.8%
26695
TRANSIT CONNECT 240 L2 DIESEL - 1.6 TDCi 115ps Limited Van
1.87%
103.2%
101.3%
Sales of Small Vans were down by 16.5% last month whilst the average sales performance at sector level was close to 100%. However, analysis at model range level revealed there were some significant differences in price performance. Consequently, whilst the guide values of most model ranges have gone down by 1% for January there are is a larger than normal list of exceptions below which either haven’t had any guide price changes or have had individual price adjustments applied.
CITROEN BERLINGO (18- ) VAN (0%)
PEUGEOT PARTNER (08-17) VAN (0%)
M-B CITAN (13- ) VAN (3%)
RENAULT KANGOO (08-13) VAN (-5%)
NISSAN NV200 (09- ) VAN (0%)
RENAULT KANGOO COMPACT (08-10) PET VAN(-5%)
PEUGEOT PARTNER E6 (18- ) VAN (0%)
RENAULT KANGOO COMPACT (08-10) VAN (-5%)
VAUXHALL COMBO E6 (18- ) VAN (0%)
VAUXHALL COMBO (12-18) VAN (-2%)
VW CADDY E6 (16- ) VAN (0%)
VW CADDY (10-14) C20 VAN CNG (0%)
VAUXHALL COMBO E6 (16-19) VAN (-2%)
VW CADDY (10-15) C20 VAN (0%)
VW CADDY (15-17) VAN (0%)
VAUXHALL COMBO (01-10) PET VAN (-2%)
CITROEN BERLINGO (08-18) VAN (0%)
VAUXHALL COMBO (01-12) VAN (-2%)
FORD CONNECT (02-07) T200 PET VAN (-5%)
VW CADDY (04-10) C20 VAN (0%)
FORD CONNECT (02-08) T210 PET VAN (-5%)
VW CADDY (96-04) FRIDGE (0%)
FORD CONNECT (02-09) T200-T230 VAN (-5%)
VW CADDY (96-04) VAN (0%)
FORD CONNECT (06-07) T210 VAN (-5%)
CAPId
Medium Van
Sector Share
%CAP
%CAP White Only Condition Adjusted
25441
TRANSIT CUSTOM 270 L1 DIESEL FWD - 2.2 TDCi 125ps Low Roof Limited Van
4.33%
97.8%
98.7%
25437
TRANSIT CUSTOM 270 L1 DIESEL FWD - 2.2 TDCi 100ps Low Roof Van
3.62%
99.6%
99.6%
25475
TRANSIT CUSTOM 290 L2 DIESEL FWD - 2.2 TDCi 125ps Low Roof Limited Van
2.50%
83.3%
101.0%
25450
TRANSIT CUSTOM 290 L1 DIESEL FWD - 2.2 TDCi 125ps Low Roof Limited Van
2.40%
97.5%
93.9%
28384
TRANSPORTER T30 SWB DIESEL - 2.0 TDI BlueMotion Tech 114PS Startline Van
2.34%
106.7%
106.7%
25440
TRANSIT CUSTOM 270 L1 DIESEL FWD - 2.2 TDCi 125ps Low Roof Trend Van
2.24%
98.8%
98.8%
25449
TRANSIT CUSTOM 290 L1 DIESEL FWD - 2.2 TDCi 125ps Low Roof Trend Van
2.19%
98.5%
102.6%
31721
VIVARO L1 DIESEL - 2700 1.6CDTI BiTurbo 120PS ecoFLEX Sportive H1 Van
1.94%
105.4%
101.2%
18442
DISPATCH L1 DIESEL - 1000 1.6 HDi 90 H1 Van Enterprise
1.83%
99.8%
103.5%
31669
VIVARO L2 DIESEL - 2900 1.6CDTI 115PS Sportive H1 Van
1.73%
96.0%
96.4%
Medium Van sector sales were down by 14% last month whilst the average price performance, at just over 100%, has remained much the same as the previous two months. After considering colour and condition and the price performances and weighting of the more predominant models we have applied a downward movement of 1% to most models in this sector with the following notable exceptions.
This month sees the introduction of a large batch of M-B Vito models on the January 2019 plate which incorporate some significant changes to the model nomenclature. Whilst the latest shape Mercedes Vito models, introduced in 2015, have always been available in high specifications, in the past this has been achieved by specifying certain options as extras at the time of ordering. The latest models are branded as ‘Pure’, ‘Progressive’ and ‘Premium’ in line with other M-B brands such as the X Class. These models already have many of the extras included which previously were optional. Rather confusingly, the wheelbases have also been renamed L1 & L2 to indemnify models that were previously Compact and Long respectively.
CITROEN DISPATCH E6 (16- ) VAN (0%)
M-B VITO (10-15) DUALINER VAN (-2%)
PEUGEOT EXPERT E6 (16- ) VAN (0%)
M-B VITO (03-10) CDi VAN (-2%)
TOYOTA PROACE E6 (16- ) VAN (0%)
M-B VITO (03-10) DUALINER VAN (-2%)
M-B VITO (03-11) CDi FRIDGE (-2%)
VW T5 TRANSPORTER (10-15) VAN (-2%)
M-B VITO (10-15) CDi VAN (-2%)
M-B VITO (05-07) PET VAN (-2%)
CAPId
Large Van
Sector Share
%CAP
%CAP White Only Condition Adjusted
26863
SPRINTER 313CDI LONG DIESEL - 3.5t High Roof Van
5.51%
88.9%
100.0%
9551
SPRINTER 313CDI LONG DIESEL - 3.5t High Roof Van
2.64%
80.9%
100.1%
22184
TRANSIT 330 MWB DIESEL FWD - Medium Roof Van TDCi 125ps
2.11%
136.0%
31707
BOXER 335 L3 DIESEL - 2.2 HDi H2 Professional Van 130ps
1.89%
95.4%
96.0%
9166
TRANSIT 300 SWB DIESEL FWD - Low Roof Van TDCi 85ps
1.89%
101.1%
99.8%
31217
RELAY 35 L3 DIESEL - 2.2 HDi H2 Van 130ps Enterprise
1.74%
92.5%
103.9%
9104
TRANSIT 260 SWB DIESEL FWD - Low Roof Van TDCi 85ps
1.66%
80.1%
93.4%
30637
TRANSIT 350 L3 DIESEL RWD - 2.2 TDCi 125ps H3 Van
1.59%
99.7%
102.4%
18677
MOVANO 35 L2 DIESEL FWD - 2.3 CDTI H2 Van 100ps Euro 4
1.51%
109.8%
105.2%
21705
CRAFTER CR35 LWB DIESEL - 2.0 TDI 136PS High Roof Van
1.51%
92.4%
96.9%
Sales in this sector were down by 15.1% last month whilst the average sales performance was around 98.5% below the average guide price. In depth analysis of the individual performances of the model ranges that make up this sector revealed some significant under-performance for some models. The guide values for the majority of models in this sector have gone down by 1% with the following notable exceptions.
IVECO DAILY E6 (14- ) VAN (-3%)
FORD TRANSIT (00-06) T260 T280 T300 VAN (-4%)
IVECO DAILY (14-17) VAN (-3%)
IVECO DAILY (06-09) 3.5t VAN (-3%)
M-B SPRINTER E6 (16- ) 2-SERIES VAN (-2%)
IVECO DAILY (06-09) VAN (-3%)
M-B SPRINTER E6 (16- ) 3-SERIES VAN (-2%)
IVECO DAILY (99-04) C CLASS VAN (-3%)
NISSAN NV400 (11- ) VAN (0%)
IVECO DAILY (99-05) S CLASS VAN (-3%)
RENAULT MASTER (10-17) dCi VAN (0%)
IVECO DAILY (99-07) L CLASS VAN (-3%)
RENAULT MASTER (14-16) dCi WINDOW VAN (0%)
IVECO DAILY CNG (04-07) VAN (-3%)
RENAULT TRUCKS MASTER (14-16) VAN (0%)
IVECO UNIJET DAILY (03-06) L CLASS VAN (-3%)
VAUXHALL MOVANO (10-17) VAN (0%)
IVECO UNIJET DAILY (03-07) C CLASS VAN (-3%)
FORD TRANSIT (06-12) T250 - T350 PET VAN (-4%)
IVECO UNIJET DAILY (03-07) S CLASS VAN (-3%)
FORD TRANSIT (06-14) T250 - T300 VAN (-4%)
M-B SPRINTER (00-06) PET VAN (-3%)
IVECO DAILY (09-15) VAN (-3%)
M-B SPRINTER (00-06) VAN (-3%)
M-B SPRINTER (13- ) 2-SERIES VAN (-3%)
M-B SPRINTER (06-13) 2-SERIES VAN (-3%)
M-B SPRINTER (13- ) 3-SERIES VAN (-3%)
M-B SPRINTER (06-13) 3-SERIES VAN (-3%)
M-B SPRINTER CNG (09-13) SERIES-3 VAN (-3%)
M-B SPRINTER (95-06) PET VAN (-3%)
CAPId
4x4 Pick-up Lifestyle SUV
Sector Share
%CAP
%CAP All Colours Condition Adjusted
22415
RANGER DIESEL - Pick Up Double Cab Limited 2.2 TDCi 150 4WD
4.69%
98.9%
97.6%
35284
L200 DIESEL - Double Cab DI-D 178 Barbarian 4WD
4.30%
93.1%
93.1%
18622
L200 LWB LB DIESEL - Double Cab DI-D Barbarian 4WD 176Bhp
4.30%
99.2%
94.6%
35006
RANGER DIESEL - Pick Up Double Cab Wildtrak 3.2 TDCi 200 Auto
4.30%
100.2%
100.2%
35285
L200 DIESEL - Double Cab DI-D 178 Barbarian 4WD Auto
3.65%
97.9%
98.8%
22419
RANGER DIESEL - Pick Up Double Cab Wildtrak 3.2 TDCi 4WD Auto
3.65%
95.9%
98.5%
19135
NAVARA DIESEL - Double Cab Pick Up Tekna 2.5dCi 190 4WD
3.52%
105.0%
98.0%
25079
AMAROK A32 DIESEL - D/Cab Pick Up Highline 2.0 BiTDI 180 BMT 4MTN Auto
3.39%
99.0%
99.0%
39510
NAVARA DIESEL - Double Cab Pick Up Tekna 2.3dCi 190 4WD
3.13%
97.0%
97.8%
35282
L200 DIESEL - Double Cab DI-D 178 Warrior 4WD
2.99%
98.2%
96.4%
Lifestyle Pickups performed relatively better than might have been expected in December considering the overall performance of the LCV Sector as a whole. Sales were down by just under 6% whilst the price performance was strong at 99.3%. After considering colour, condition and the weighting effect on the price performance of certain models it was necessary to move the guide values down by 1% with the following notable exceptions…
FORD RANGER (15- ) PICK-UP LIFE (0%)
TOYOTA HILUX (10-16) D-4D LIFE (0%)
MERCEDES-BENZ X CLASS DIESEL (2017- ) (-2%)
FORD RANGER (09-11) LIFE (0%)
MITSUBISHI L200 (15- ) DI-D LIFE (-2%)
ISUZU RODEO (03-07) LIFE (0%)
TOYOTA HILUX E6 (16- ) LIFE (0%)
MITSUBISHI L200 (01-07) TD/TD 113 LIFE (0%)
VW AMAROK (16- ) LIFE (5%)
TOYOTA HILUX (01-10) PICK-UP LIFE (0%)
ISUZU RODEO (07-12) LIFE (2%)
FORD RANGER (02-06) PICK-UP LIFE (-5%)
MITSUBISHI L200 (06-16) DI-D LIFE (0%)
NISSAN NAVARA (03-05) LIFE (-5%)
HGV MARKETPLACE
CAPId
4x4 Pick-up Workhorse
Sector Share
%CAP
%CAP All Colours Condition Adjusted
35425
NP300 NAVARA DIESEL - Double Cab Pick Up Visia 2.3dCi 160 4WD
9.55%
82.6%
86.9%
22413
RANGER DIESEL - Pick Up Double Cab XL 2.2 TDCi 150 4WD
8.43%
101.3%
99.9%
21664
HILUX DIESEL - HL2 Extra Cab Pick Up 2.5 D-4D 4WD 144
7.30%
113.3%
104.4%
30784
HILUX DIESEL - Active D/Cab Pick Up 2.5 D-4D 4WD 144
6.18%
99.2%
96.5%
16756
HILUX DIESEL - HL2 2010 D/Cab Pick Up 2.5 D-4D 4WD 144
6.18%
91.8%
91.8%
21665
HILUX DIESEL - HL2 D/Cab Pick Up 2.5 D-4D 4WD 144
5.62%
102.1%
97.2%
16571
RANGER DIESEL - Pick Up Double Cab XL 2.5 TDCi 4WD
4.49%
100.2%
100.2%
11085
DEFENDER 130 LWB DIESEL - Chassis Cab TDCi
2.81%
98.8%
98.8%
38351
HILUX DIESEL - Active D/Cab Pick Up 2.4 D-4D
2.81%
99.2%
99.2%
21893
DEFENDER 110 LWB DIESEL - Hard Top TDCi [2.2]
2.81%
76.2%
80.8%
4x4 Workhorse sector sales were down by almost 7% last month whilst the average price performance against the guide values were down by just under 1.5%. A downward price movement of 1% has been applied to most model ranges in this sector with a larger than usual list of ranges that have either had no price changes or individual prices changes applied…
FORD RANGER (15- ) CHASSIS PICK-UP WORK (0%)
LAND ROVER (05-07) DEFENDER 110 Td5 (0%)
ISUZU D-MAX DIESEL (17- ) (0%)
LAND ROVER (06-07) DEFENDER Td5 130 (0%)
LAND ROVER (11-16) DEFENDER 90 110 130 TDCi (0%)
LAND ROVER DISCOVERY (93-05) Tdi Td5 (-2%)
LAND ROVER DISCOVERY (18 - ) Euro 6 (-2%)
MAZDA B-SERIES (99-07) PICK-UP (5%)
LAND ROVER FREELANDER 2 (08-10) (0%)
MITSUBISHI L200 (06-10) DI-D WORK (-2%)
MITSUBISHI SHOGUN (14-18) (0%)
MITSUBISHI SHOGUN (00-06) PET (0%)
NISSAN NAVARA E6 (16- ) PICK-UP (0%)
NISSAN 1 TON (98-07) PICK-UP (0%)
FORD RANGER (11-16) CHASSIS WORK (0%)
NISSAN NAVARA (13-16) PICK UP (0%)
FORD RANGER (11-16) PICK-UP WORK (0%)
NISSAN TERRANO II (98-07) (0%)
ISUZU D-MAX DIESEL (12-18) (0%)
FORD RANGER (02-06) PICK-UP WORK (-3%)
LAND ROVER (07-11) DEFENDER 90 110 130 TDCi (0%)
FORD RANGER (05-06) CHASSIS (-3%)
LAND ROVER DISCOVERY (07-09) (-2%)
FORD RANGER (06-09) CHASSIS (-3%)
LAND ROVER DISCOVERY (09- ) (-2%)
FORD RANGER (06-09) PICK-UP WORK (-3%)
LAND ROVER FREELANDER (99-05) PET (0%)
FORD RANGER (06-09) TIP (-3%)
LAND ROVER FREELANDER (99-07) (0%)
LAND ROVER (98-06) DEFENDER 110 Td5 (0%)
MITSUBISHI SHOGUN (00-16) (0%)
LAND ROVER (98-07) DEFENDER 130 Td5 (0%)
NISSAN NP300 (08-10) PICK-UP (0%)
LAND ROVER (98-07) DEFENDER 90 Td5 (0%)
NISSAN NP300 NAVARA (16-16) PICK-UP (0%)
MITSUBISHI L200 (01-04) TD/TD 113 WORK (-2%)
NISSAN PATHFINDER (05-12) DIESEL (0%)
MITSUBISHI L200 (04-07) TD/TD 113 WORK (-2%)
FORD RANGER (09-11) CHASSIS (0%)
NISSAN NAVARA (02-05) WORK (0%)
FORD RANGER (09-11) PICK-UP WORK (0%)
NISSAN NAVARA (05-08) WORK (0%)
FORD RANGER (09-11) TIP (0%)
Auctions remained pretty active in the lead up to Christmas and a good selection of fresh stock was available, however, sales were not as brisk as in recent months and a general slowing down for Christmas was noticeable.
The holiday period offers the opportunity to re-stock before auctions resume business in the New Year but many traders failed to grasp the opportunity, hoping for better things later this month. Vehicles from the traditional Christmas de-fleets often begin to appear in January but it is usually early February before they start arriving in any quantity.
It is rumoured amongst the trade that this year’s post-Christmas de-fleets may be much smaller than those of recent years as many operators appear to indicate that they will be holding onto vehicles, so it will be interesting to see how much stock does appear and if the trailer market will again suffer from a significant influx of boxes and curtains.
Old stock remains a problem especially so as more of it is entering the market than is leaving it, filling auctions with substandard old vehicles which nobody really wants and with more vehicles expected to hit the market imminently some auctions may be struggling for space very soon.
Traders report that business has become fairly subdued and currently many businesses are just ticking over waiting for trade to get back into full swing after Christmas. This is fully expected and accepted over the festive season until trade starts to regain momentum again in January. Several buyers are on the lookout for specific vehicles, but on the whole most are currently keeping their wallets firmly closed.
Some of the larger independent dealers continue to suffer from the short supply of quality late registered stock with some of them acquiring vehicles direct from manufacturers to fulfil requirements. Manufacturers themselves continue to report good sales citing the continued desire for Euro 6 rigids and low mileage tractor units. Stocks of Euro 5 vehicles are starting to concern some manufacturers.
Records from our auction visits indicate that the average number of auction entries remained the same last month but the number of on-the-day truck sales decreased by over 10% in relation to total entries. Trailer sales also decreased by almost 5% over the same period.
This is based on eight auction visits and a total of 1144 viewed lots, and as we always remind you, these are ‘hammer sales’ on-the-day and converted provisional sales are not included. One auction reports that the conversion rate of provisional sales has risen to around 60%.
This month’s research indicates that:
- Up to 7.5t - Values have generally fallen a little across the board.
- 5t to 12t – Values have fallen a little here too, including with a few exceptions, values of Euro 6 variants.
- 13t to 18t – Values have decreased slightly, including those of Euro 6 models, although there are some exceptions here too.
- Multi-wheel rigids – Values of both three and four axle rigids have fallen slightly with the exception of Euro 6 derivatives where values have remained comparable to last month.
- Tractor units – 4x2 values have decreased just a little.
- Pre-Euro 5 6x2 models have seen a slight decrease as have most Euro 5 models. There are some makes and models where values have either remained steady or have, in a few instances, actually increased.
- Similar is true of Euro 6 examples.
- Trailers – Values of trailers have remained similar to last month.
7.5t to 12t Vehicles
Euro 5 7.5t boxes, predominantly DAF and Iveco’s, continue to appear for sale in numbers. Boxes are now in plentiful supply and whilst the tidiest examples are finding new homes values are being pressured and the untidy ones are failing to attract sufficient attention of buyers.
Curtains remain steady away whilst fridges, like boxes, are also numerous with many examples being on lightweight Isuzu and Mitsubishi chassis although plenty of other marques are readily available. As a result of the quantities available values have fallen slightly. Even fridges with meat rails which usually stir additional interest failed to muster any enthusiasm of the gathered throng.
Good availability of tippers, especially low mileage Euro 6 examples, were well appreciated by the trade who have snapped them up as they appeared. Pre- Euro 6 vehicles are not selling so swiftly and currently only the cleanest, lowest mileage examples are achieving positive outcomes.
Dropsides remain relatively scarce but here too sales have not been as fluent as they were just a few months ago but that is possibly due to it being winter when such vehicles are usually in less demand.
Refuse vehicles which often have low mileage are less numerous than their larger cousins and they often attract more attention. However, body specification, chassis manufacturer and condition dictate the level of such interest.
7.5 tonne car transporters continue to provoke strong bidding whether they are tilt and slide or double deck. However, strong bidding doesn’t always result in a sale. A selection of 2012 and 2013 yellow tilt and slide 12 tonne MAN TGL 12.220 crew cabs with around half a million kilometres were well received when they appeared for sale.
Horse boxes are not a common sight at auction, especially newer tidy ones, so a 2013 62 plate DAF FA LF45.160 7.5 tonne example appeared it prompted strong bidding, eventually selling for £11,200.
13t to 18t Vehicles
With most examples on offer being over five years of age only the best vehicles are currently selling.
Just like the 7.5t sector there are plenty of fridges available, mainly on DAF chassis, and most of which are of questionable quality and many are being ignored by prospective buyers.
Late model boxes and curtains remain virtually non-existent and attract good attention when they do appear, but this does not necessarily result in a sale as vendor expectations remain high.
Skip vehicles remain reasonably popular and ready to use examples usually sell when they appear, especially those with extendable arms.
Tippers are not so numerous at present and are still being traded despite the season, as are gritter/ploughs, particularly ones with Econ equipment fitted.
Sweepers often prompt strong interest and one example which did just that was a 2013 63 plate left hand drive DAF FA LF55.220 with Johnson dual sweep body and 103,000 kilometres. It sold for £43,700.
Multi-wheelers
The number of 6x4 and 8x4 tippers has slowed a little, possibly due to the time of year, but those that do appear still attract interest, especially so when cranes are fitted.
Refuse trucks, particularly older ones, remain a problem and most are struggling to find new homes and often attract bids which still do not reflect their true value. That said, examples under seven years old do attract attention and often sell. One example being a 2013 13 plate Mercedes Benz Econic 3233 tridem with Heil body and Terberg twin bin lifts and 72,000 kilometres which sold for £21,000.
Hook-loaders and skips continue to sell but price usually reflects condition rather than mileage which is not always such a major consideration for such vehicles.
Draw-bar outfits and car carrier rigs, whilst not so plentiful, continue to struggle to find buyers.
The 2011 61 plate Iveco Trakker AD380T41 day cab 6x6 gritters mentioned last month re-appeared at auction and again failed to find favour, the best bid this time being £7,500.
Whilst Hino’s are not unusual they almost exclusively appear in 8x4 tipper guise so when a 2010 10 plate Hino 700 series 2638 6x4 sleeper cab flat with a Palfinger PK12000 brick and block grab appeared it caused a stir and it sold for £11,600.
Tractor Units
Euro 5 4x2 and 6x2 examples are not as numerous as they have been of late and many are selling, Even the once very numerous Euro 5 6x2 Renault Premiums 460’s with Privilege sleeper cabs are now finding homes easily and their values have improved in recent months.
2013 Volvo FH460 6x2 Globetrotters are numerous at present and values are starting to reflect such. They are all from the same vendor and are bright yellow. Some have been around since well before Christmas and therefore they may find it even tougher to find buyers post-Christmas.
Values of most Euro 5 and pre-Euro 5 vehicles have fallen slightly but some notable exceptions include 2009 to 2013 model Mercedes Benz Actros, Mercedes Benz Axor’s, Scania G and Scania R models all of which have sold well recently.
The availability of Euro 6 6x2 vehicles continues to increase and here too Volvo FH460 Globetrotters are plentiful which is doing little for their values which are in decline. Renault T’s have appeared in increased numbers and whilst initial sales were nothing to shout home about recent transactions have seen values improve.
Sales of the few Euro 6 Scania’s seen have remained steady but generally as more vehicles appear in the market values are starting to be pressed. This may become more apparent in the New Year when stocks of tractor units available for sale usually increases.
An unusual vehicle which sold at auction recently was a 2001 left hand drive bonneted Volvo NH126x4 sleeper which surprisingly created plenty of interest selling for £20,000.
Trailers
Research indicates that the trailer market is reasonably healthy at present but that comes with a health warning as it appears to have slowed a little towards Christmas and the traditional post-Christmas de-fleets are still to hit the market which may affect sales and values
A further batch of clean 2016 tri-axle curtains once again proved very popular again and all sold as they appeared.
Flats are selling well at present and a pair of clean 2014 triaxle examples with BPW axles and drum brakes provoked a strong bidding resulting in the sale of them both.
Several 8.5m single-axle brewery specification curtains used for urban deliveries have been available but their age and scruffy condition resulted in little interest and in all likelihood they will eventually pass for breaking.
Providing a trailer is ready to run it will generally prompt interest but there remains generous numbers of older trailers that are struggling to find buyers and these are unlikely to be sold any time soon.

