
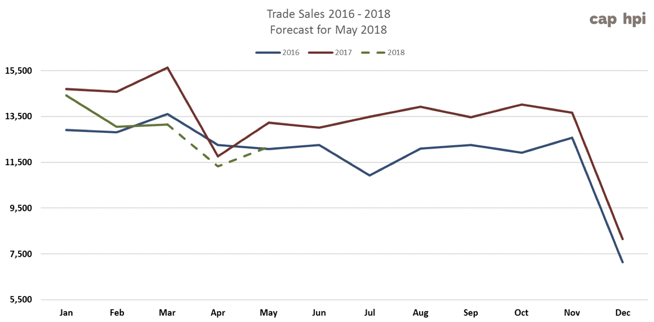
The Easter holiday break seems to have had very little impact on the used LCV market. If anything the auctions we attended during the first two weeks of April were busier than we had seen in previous weeks and, if there were fewer professional buyers around, then it wasn’t really noticeable as their absence was more than compensated for by non-trade buyers. The actual recorded sales were only marginally behind the same period last year and slightly lower than last month’s forecast at just under 11,500 vehicles.
Bidding was brisk at most of the sales with some vendors reporting exceptionally high conversion rates, however, some sections, particularly those without vendor representation did appear to struggle at times.
From a supply perspective, initially there seemed to be plenty of stock around to suit every pocket but as the month progressed we sensed that some professional buyers were holding back and that supply was becoming an issue. According to the sale catalogues we monitor auction entries were down by around 9% compared to the previous month.
Supply Trend: Auction Catalogue Entries
May-17
Jun-17
Jul-17
Aug-17
Sep-17
Oct-17
Nov-17
Dec-17
Jan-18
Feb-18
Mar-18
Apr-18
Auction Entries % Var
7%
-2%
4.50%
-2%
-25%
19%
5%
-1%
2%
6%
-16%
-9%
Average age (Months)
59
59
57
61
59
60
61
58
59
60
61
64
Average Mileage
72879
72264
74050
73821
72201
73283
76,195
72451
72,318
74,589
75,676
76,127
On the whole the quality of the stock was good and we saw many examples of vehicles that truly were “ready to retail”, most notably Lifestyle 4x4 Pick-ups. As always though there were still many vehicles lined up that hadn’t been cleaned and exhibiting livery shadow. The average age of vehicles moved up slightly from 62 months to 64 Months (MTD) whilst the average recorded mileage increased from 75,926 to 76,127(MTD).
Auction re-entries were also down by around 5% giving a further indication that market might be heading towards a supply and demand imbalance. Another explanation though could be that some of the less desirable stock that had been passed over by trade buyers in recent weeks had found homes directly with retail buyers.
In the longer term we are not expecting this to amount to anything like a supply crisis. If we consider the potential volume of 3 year old LCV stock for 2018 by comparing the 2014 and 2015 new LCV registration figures, it’s clear that there has been substantial year on year increases in all but two subsectors, Small Vans and Minibuses. Since the vast majority of new LCVs tend to be registered in March, all things being equal, we ought to be seeing similar increases in 2015 March plate used stock entering the market during the second quarter of 2018.
2018 - Potential increase in 3 year old used LCV stock
LCV Sector
2014
2015
YOY Var %
City Van
14857
16793
13.0%
Small Van
77255
76395
-1.1%
Medium Van
92045
117827
28.0%
Large Van
58122
66406
14.3%
Over 3.5T
969
1331
37.4%
4x4 Pick-up Workhorse
9520
10678
12.2%
4x4 Pick-up Lifestyle SUV
29425
35902
22.0%
Forward Control Vehicle
856
1052
22.9%
Chassis - Derived
23078
24208
4.9%
Mini-bus
311
274
-11.9%
Vat Qualifying
3814
4445
16.5%
Vat Qualifying
310252
355311
14.5%
However, so far these vehicles have failed to materialise in the numbers we had expected and with auction entries down month on month it is little wonder that the market prices of 3 year old LCVs remain high at this time as professional buyers compete for stock.
As each month passes by and each registration plate for each vehicle in Red Book gets one month older it would be reasonable to expect the guide values to decrease over time. However, at sector level as the following chart clearly shows, the demand for used LCVs has been so high since the beginning of 2018 that prices haven’t really been depreciating at all.
Sales Performance by Sector
February 2018
March 2018
April 2018
LCV Sector
Market Share
Performance
Market Share
Performance
Market Share
Performance
City Van
4.5%
98.1%
4.3%
101.6%
3.9%
100.7%
Small Van
24.7%
101.4%
22.9%
103.1%
25.8%
104.5%
Medium Van
27.6%
100.8%
29.8%
100.9%
29.6%
102.8%
Large Van
19.3%
100.1%
18.9%
100.3%
16.7%
100.2%
Over 3.5T
0.2%
101.7%
0.2%
103.3%
0.1%
105.6%
4x4 Pick-up Workhorse
2.7%
99.4%
2.2%
99.8%
2.6%
98.4%
4x4 Pick-up Lifestyle SUV
11.7%
99.5%
11.7%
99.6%
12.9%
100.5%
Forward Control Vehicle
0.2%
95.7%
0.1%
98.1%
0.2%
105.9%
Chassis - Derived
5.8%
97.8%
7.6%
98.7%
5.6%
98.6%
Mini-bus
0.9%
96.4%
0.6%
99.9%
0.9%
103.3%
Vat Qualifying
2.3%
97.3%
1.5%
100.0%
1.7%
99.2%
Total Market
100.0%
100.2%
100.0%
100.9%
100.0%
102.1%
Guide Price Movements in this Edition
May: LCV Used Guide Price Movements 3 year / 60k
LCV Sector
Average % Movement
Average £ Movement
City Van
0.7%
£26
Small Van
1.9%
£90
Medium Van
0.1%
£10
Large Van
-0.2%
-£15
Over 3.5T
-0.6%
-£70
4x4 Pick-up Workhorse
-1.3%
-£157
4x4 Pick-up Lifestyle SUV
0.3%
£37
Forward Control Vehicle
0.1%
£7
Chassis - Derived
-0.9%
-£89
Mini-bus
-1.2%
-£116
Vat Qualifying
0.2%
£25
Vehicle colour / price guide
Whilst auction catalogue entries always specify colour, it’s the guide values of White vans that you will see printed in the auction catalogues.
White remains the colour choice for most new LCV buyers, however, increasingly we are seeing more and more vans in other colours entering the used wholesale market. The chart below is intended as a guide to illustrate how more or less in percentage terms you would expect to pay for a vehicle in any of the colours listed. For example, if you were bidding on a Silver van in the City Van sector you can expect to pay on average 2.05% more than you’d pay for the same van in White. The values shown in this table are based on actual trade sales of vehicles at open auctions and that at any given time the market values of vehicles are dependent on many other factors such as supply volume and condition.
Top 10 models driving the used LCV Market
Colours
City Van
Small Van
Medium Van
Large Van
4x4 Workhorse
4x4 Lifestyle
Mini-bus
VAT Qualifying
White
CAP Avg
CAP Avg
CAP Avg
CAP Avg
CAP Avg
CAP Avg
CAP Avg
CAP Avg
Silver
2.05%
3.29%
2.63%
4.59%
0.75%
0.87%
-0.95%
1.68%
Blue
-0.63%
-0.26%
2.22%
0.05%
0.97%
0.57%
-1.53%
1.36%
Black
3.67%
4.34%
3.79%
3.56%
1.70%
0.62%
3.63%
Grey
4.20%
5.03%
4.02%
3.39%
1.95%
0.93%
4.03%
Red
0.31%
-0.80%
1.22%
-1.56%
0.39%
-0.18%
1.48%
Yellow
-3.43%
-3.96%
-6.61%
-7.83%
Green
-0.25%
-2.49%
-3.30%
-2.48%
1.11%
-0.04%
4.39%
The Top 10 tables below gives you a clear picture of the makes and models in the main LCV sectors that are driving the prices in the used LCV Market. Arranged in order of their respective share of total sector sales, the percentage CAP performance is based on actual recorded sales at open auctions.
Since our guide values reflect the market prices of basic vans in plain white as they appear in the vehicle manufacturer’s price lists, some of guide price movements you might see in this edition may not correlate directly with the sales performances shown in the tables since these include vehicles in all colours and specifications.
|
CAPId |
City Van |
Sector Share |
%CAP |
%CAP White Only Condition Adjusted |
||||||||||||
|
26326 |
FIESTA DIESEL - 1.6 TDCi ECOnetic Van |
10.70% |
87.2% |
103.3% |
||||||||||||
|
26324 |
FIESTA DIESEL - 1.5 TDCi Van |
5.69% |
101.7% |
99.1% |
||||||||||||
|
20784 |
FIESTA DIESEL - 1.4 TDCi 70 Van |
4.68% |
100.9% |
96.5% |
||||||||||||
|
24217 |
NEMO DIESEL - 1.3 HDi Enterprise [non Start/Stop] |
4.35% |
95.9% |
103.5% |
||||||||||||
|
24233 |
BIPPER DIESEL - 1.3 HDi 75 Professional [non Start/Stop] |
4.35% |
107.3% |
109.7% |
||||||||||||
|
30869 |
TRANSIT COURIER DIESEL - 1.5 TDCi Van |
3.68% |
104.8% |
104.7% |
||||||||||||
|
26328 |
FIESTA DIESEL - 1.6 TDCi Sport Van |
2.68% |
106.2% |
114.1% |
||||||||||||
|
24229 |
BIPPER DIESEL - 1.3 HDi 75 S [SLD] [non Start/Stop] |
2.68% |
102.8% |
102.8% |
||||||||||||
|
20800 |
FIORINO CARGO DIESEL - 1.3 16V Multijet SX Van Start Stop |
2.68% |
91.9% |
98.1% |
||||||||||||
|
21678 |
ASTRAVAN DIESEL - Club 1.7 CDTi ecoFLEX Van |
2.34% |
75.0% |
88.6% |
||||||||||||
|
With an overall sector sales performance of 100.7%, on face value this was another strong month for the City Vans. However, Ford Fiesta models dominated this sector and was largely responsible for the over-performance. After taking this into account as well as colour and condition the average sector performance was level. Consequently, we have not applied a general market movement to models in this sector for this edition with the notable exceptions listed below. Worthy of note is Ford Courier which was particularly well received at auctions last month. Although market prices were seemingly in a state of flux during the first quarter as they fell cumulatively by around 5%, last month they bounced back and we increased the guide values by 1%. This month we have seen further strength in their performance which has warranted a further increase of 2%.
|
||||||||||||||||
|
CAPId |
Small Van |
Sector Share |
%CAP |
%CAP White Only Condition Adjusted |
||||||||||||||||||||||||||||||||||
|
18445 |
BERLINGO L1 DIESEL - 1.6 HDi 625Kg Enterprise 75ps |
13.57% |
108.1% |
106.0% |
||||||||||||||||||||||||||||||||||
|
28276 |
CADDY MAXI C20 DIESEL - 1.6 TDI 102PS Startline Van |
5.75% |
104.4% |
101.6% |
||||||||||||||||||||||||||||||||||
|
30768 |
NV200 DIESEL - 1.5 dCi Acenta Van |
2.55% |
106.7% |
106.3% |
||||||||||||||||||||||||||||||||||
|
26689 |
TRANSIT CONNECT 200 L1 DIESEL - 1.6 TDCi 115ps Limited Van |
2.07% |
113.2% |
110.0% |
||||||||||||||||||||||||||||||||||
|
18446 |
BERLINGO L1 DIESEL - 1.6 HDi 850Kg Enterprise 90ps |
2.02% |
106.8% |
103.4% |
||||||||||||||||||||||||||||||||||
|
28266 |
CADDY C20 DIESEL - 1.6 TDI 102PS Startline Van |
2.02% |
109.3% |
100.3% |
||||||||||||||||||||||||||||||||||
|
20709 |
CADDY MAXI C20 DIESEL - 1.6 TDI 102PS Van |
1.90% |
115.2% |
98.5% |
||||||||||||||||||||||||||||||||||
|
22432 |
PARTNER L1 DIESEL - 850 S 1.6 HDi 92 Van [SLD] |
1.72% |
101.6% |
99.8% |
||||||||||||||||||||||||||||||||||
|
26630 |
KANGOO DIESEL - ML19dCi 75 eco2 Van |
1.66% |
110.7% |
108.7% |
||||||||||||||||||||||||||||||||||
|
15182 |
BERLINGO L1 DIESEL - 1.6 HDi 625Kg LX 75ps |
1.42% |
115.8% |
106.4% |
||||||||||||||||||||||||||||||||||
|
With an overall sector sales performance of 104.5% after taking into account colour, condition and the weighting of the sales performances of some individual model ranges, this sector has actually under-performed. Consequently a downward market movement of 2% has been applied in this edition. The following list of exceptions include a number of ranges that have had price increases which accounts for the apparent over-performance. We continue to closely monitor the price performances of late model VW Caddy in response to a large number of them that have been de-fleeted earlier than expected by a former large facilities management and construction services company. Also worthy of noting is the price performance of NV200 which have been available in larger numbers due to a utility company de-fleet. Although most were exhibiting livery shadow the majority were undamaged clearly popular with buyers.
|
||||||||||||||||||||||||||||||||||||||
|
CAPId |
Medium Van |
Sector Share |
%CAP |
%CAP White Only Condition Adjusted |
||||||||||||||||||||||||||||||||||
|
25441 |
TRANSIT CUSTOM 270 L1 DIESEL FWD - 2.2 TDCi 125ps Low Roof Limited Van |
3.86% |
104.7% |
103.1% |
||||||||||||||||||||||||||||||||||
|
31668 |
VIVARO L2 DIESEL - 2900 1.6CDTI 115PS H1 Van |
3.30% |
95.4% |
95.6% |
||||||||||||||||||||||||||||||||||
|
25437 |
TRANSIT CUSTOM 270 L1 DIESEL FWD - 2.2 TDCi 100ps Low Roof Van |
2.99% |
103.3% |
103.4% |
||||||||||||||||||||||||||||||||||
|
31669 |
VIVARO L2 DIESEL - 2900 1.6CDTI 115PS Sportive H1 Van |
2.64% |
101.5% |
100.5% |
||||||||||||||||||||||||||||||||||
|
31732 |
VIVARO L2 DIESEL - 2900 1.6CDTI BiTurbo 120PS ecoFLEX Sportive H1 Van |
2.64% |
107.0% |
105.3% |
||||||||||||||||||||||||||||||||||
|
25446 |
TRANSIT CUSTOM 290 L1 DIESEL FWD - 2.2 TDCi 100ps Low Roof Van |
2.49% |
101.4% |
101.8% |
||||||||||||||||||||||||||||||||||
|
26570 |
TRANSIT CUSTOM 270 L1 DIESEL FWD - 2.2 TDCi 100ps Low Roof Van ECOnetic |
2.44% |
102.7% |
103.1% |
||||||||||||||||||||||||||||||||||
|
31579 |
TRAFIC SWB DIESEL - SL27 ENERGY dCi 120 Business Van |
2.38% |
110.3% |
110.3% |
||||||||||||||||||||||||||||||||||
|
18442 |
DISPATCH L1 DIESEL - 1000 1.6 HDi 90 H1 Van Enterprise |
2.23% |
106.0% |
103.3% |
||||||||||||||||||||||||||||||||||
|
25475 |
TRANSIT CUSTOM 290 L2 DIESEL FWD - 2.2 TDCi 125ps Low Roof Limited Van |
1.88% |
102.6% |
100.8% |
||||||||||||||||||||||||||||||||||
|
Not only is Medium Van the largest and most complex sector in terms of the diversity of models and sheer number of them in the used market at any given point in time, last month we saw some extreme variations in price performance. After taking into account colour and condition 25 model ranges were under-performing on average by around 2% whilst 16 model ranges were over-performing by between 1% and 3%. There were also 18 model ranges that were right on the money and didn’t require any price adjustments for this edition. A downward market movement of -2% has been applied all but the following ranges in this edition. Ford Custom prices remain strong regardless of the large volumes available in the market; there were almost 2.5 times more Ford Custom that their nearest rival the Renault Trafic (16-16) dCi Van.
|
||||||||||||||||||||||||||||||||||||||
|
CAPId |
Large Van |
Sector Share |
%CAP |
%CAP White Only Condition Adjusted |
||||||||||||||||||||||||||||
|
26863 |
SPRINTER 313CDI LONG DIESEL - 3.5t High Roof Van |
4.15% |
94.1% |
94.5% |
||||||||||||||||||||||||||||
|
9155 |
TRANSIT 280 SWB DIESEL FWD - Low Roof Van TDCi 85ps |
2.85% |
97.8% |
102.1% |
||||||||||||||||||||||||||||
|
31707 |
BOXER 335 L3 DIESEL - 2.2 HDi H2 Professional Van 130ps |
2.68% |
103.7% |
103.4% |
||||||||||||||||||||||||||||
|
9104 |
TRANSIT 260 SWB DIESEL FWD - Low Roof Van TDCi 85ps |
2.68% |
90.3% |
96.5% |
||||||||||||||||||||||||||||
|
31217 |
RELAY 35 L3 DIESEL - 2.2 HDi H2 Van 130ps Enterprise |
2.28% |
101.0% |
102.2% |
||||||||||||||||||||||||||||
|
30637 |
TRANSIT 350 L3 DIESEL RWD - 2.2 TDCi 125ps H3 Van |
1.95% |
100.7% |
102.5% |
||||||||||||||||||||||||||||
|
22129 |
TRANSIT 280 SWB DIESEL FWD - Low Roof Van TDCi 100ps |
1.95% |
101.7% |
98.0% |
||||||||||||||||||||||||||||
|
22135 |
TRANSIT 280 SWB DIESEL FWD - Medium Roof Van TDCi 100ps |
1.87% |
103.3% |
104.5% |
||||||||||||||||||||||||||||
|
22155 |
TRANSIT 300 SWB DIESEL FWD - Low Roof Van TDCi 100ps |
1.87% |
105.7% |
105.0% |
||||||||||||||||||||||||||||
|
33533 |
MASTER LWB DIESEL FWD - LM35dCi 125 Business Medium Roof Van |
1.71% |
103.9% |
102.5% |
||||||||||||||||||||||||||||
|
With an average price performance of 100.2% at first glance it would seem that Large Vans were performing well last month. However, 53 model ranges were under-performing by between -1% and -2% whilst only 22 ranges over-performed slightly. After taking into account colour, condition and the weighting of some models that performed well, the guide prices values of most models in this sector are unchanged this month with the following notable exceptions.
|
||||||||||||||||||||||||||||||||
|
CAPId |
4x4 Pick-up Workhorse |
Sector Share |
%CAP |
%CAP All Colours Condition Adjusted |
||||||||
|
21665 |
HILUX DIESEL - HL2 D/Cab Pick Up 2.5 D-4D 4WD 144 |
13.26% |
102.3% |
101.7% |
||||||||
|
30784 |
HILUX DIESEL - Active D/Cab Pick Up 2.5 D-4D 4WD 144 |
12.15% |
89.7% |
90.9% |
||||||||
|
16756 |
HILUX DIESEL - HL2 2010 D/Cab Pick Up 2.5 D-4D 4WD 144 |
9.39% |
106.1% |
99.4% |
||||||||
|
21663 |
HILUX DIESEL - HL2 Pick Up 2.5 D-4D 4WD 144 |
5.52% |
113.0% |
109.4% |
||||||||
|
22413 |
RANGER DIESEL - Pick Up Double Cab XL 2.2 TDCi 150 4WD |
4.97% |
96.0% |
95.3% |
||||||||
|
11073 |
DEFENDER 110 LWB DIESEL - Hard Top TDCi |
3.87% |
80.3% |
90.5% |
||||||||
|
21901 |
DEFENDER 110 LWB DIESEL - XS Utility Wagon TDCi [2.2] |
3.31% |
100.1% |
100.1% |
||||||||
|
29907 |
DISCOVERY DIESEL - XS Commercial Sd V6 Auto |
2.76% |
102.6% |
102.6% |
||||||||
|
21887 |
DEFENDER 90 SWB DIESEL - Hard Top TDCi [2.2] |
2.76% |
117.8% |
109.3% |
||||||||
|
26500 |
NAVARA DIESEL - Double Cab Pick Up Visia 2.5dCi 144 4WD |
2.76% |
107.1% |
107.1% |
||||||||
|
Slightly higher sales volumes than we have seen for quite a while in the Workhorse Sector whilst price performance fell short of the guide again at 98.4%. A downward market movement of -2% has been applied to most model ranges in this sector with exception of the following ranges below. Once again Land Rover Defender prices remained relatively stable last month so their guide values are unchanged for this edition.
|
||||||||||||
|
CAPId |
4x4 Pick-up Lifestyle SUV |
Sector Share |
%CAP |
%CAP All Colours Condition Adjusted |
||||||||||||||||||
|
35284 |
L200 DIESEL - Double Cab DI-D 178 Barbarian 4WD |
5.98% |
104.1% |
104.1% |
||||||||||||||||||
|
35006 |
RANGER DIESEL - Pick Up Double Cab Wildtrak 3.2 TDCi 200 Auto |
5.85% |
97.8% |
97.8% |
||||||||||||||||||
|
19137 |
NAVARA DIESEL - D/Cab Pick Up Tekna [Connect] 2.5dCi 190 4WD |
4.83% |
101.8% |
99.0% |
||||||||||||||||||
|
35285 |
L200 DIESEL - Double Cab DI-D 178 Barbarian 4WD Auto |
4.58% |
103.5% |
102.9% |
||||||||||||||||||
|
18622 |
L200 LWB LB DIESEL - Double Cab DI-D Barbarian 4WD 176Bhp |
4.33% |
111.4% |
100.2% |
||||||||||||||||||
|
35282 |
L200 DIESEL - Double Cab DI-D 178 Warrior 4WD |
4.07% |
101.8% |
101.8% |
||||||||||||||||||
|
25079 |
AMAROK A32 DIESEL - D/Cab Pick Up Highline 2.0 BiTDI 180 BMT 4MTN Auto |
3.69% |
105.0% |
103.8% |
||||||||||||||||||
|
19135 |
NAVARA DIESEL - Double Cab Pick Up Tekna 2.5dCi 190 4WD |
2.93% |
105.9% |
100.1% |
||||||||||||||||||
|
22419 |
RANGER DIESEL - Pick Up Double Cab Wildtrak 3.2 TDCi 4WD Auto |
2.80% |
103.7% |
103.7% |
||||||||||||||||||
|
18623 |
L200 LWB LB DIESEL - Double Cab DI-D Barbarian 4WD Auto 176Bhp |
2.54% |
106.9% |
100.0% |
||||||||||||||||||
|
The overall price performance for this sector last month hovered just above 100% of the average guide values on closer examination 17 ranges were under-performing by around -2%. A tempered downward market movement of -1% has been applied to most ranges in this sector with exception of the model ranges listed below
|
||||||||||||||||||||||
HGV MARKETPLACE
Auction attendances have recovered a little recently and sales have remained steady rather than brisk, which was the situation a few months ago. A good selection of fresh stock keeps appearing to stimulate buyer interest but as previously mentioned, large batches of similar vehicles available in the market often find it difficult to be absorbed quickly so the less desirable offerings continue to re-appear as buyer’s remain fixed to the freshest offerings.
Further ex-Palmer and Harvey vehicles have appeared at auction and whilst the odd 18 tonne Mercedes-Benz Atego 1824 box keeps popping up amongst them it is mainly five or six year old 7.5 tonne Mitsubishi Fuso Canter 7C15 and Isuzu N75.190 boxes which are on offer. Sales are taking place and values have been quite strong but the large numbers available means that it is likely that some of them may be around for little while yet.
There are also considerable batches of similar vehicles from other national operators and desirability rests on age, condition and mileage and because many are of basic specification and over eight years of age sales are not so swift and some of them offer only a limited future use with some vehicles being viewed as parts only by some dealers, especially those in poorest condition or with high mileage.
It is a fact that some auctions are having more success than others at achieving first time sales but that is often related to the mix and age of the vehicles and trailers they have to offer. As major fleets continue to re-fleet it’s not unusual so see handfuls of similar specification vehicles at the same sale. As always the best ones are cherry picked, leaving the less desirable examples to appear at subsequent sales.
Euro 6 rigid vehicles remain relatively scarce but numbers are on the increase and although run of the mill boxes, curtains and fridges are sought after, prices currently being paid are becoming more realistic. As Euro 6 values start to fall it will undoubtedly have an impact on Euro 5 values.
Dealers report that business remains steady at present and manufacturers report continued healthy sales with the exception of some multi-wheelers where some values are struggling a little.
Records from our auction visits indicate that the average number of auction entries increased by almost 7.5% last month but the number of on-the-day sales of trucks decreased yet again, this time by just over 1% in relation to total entries. Trailer sales however increased by over 4%.
This is based on eight auction visits and a total of 1411 viewed lots. As we always point out these are ‘hammer sales’ on-the-day and converted provisional sales are not included. One auction reports that the conversion rate of provisional sales remains around the 70%.
This month’s research indicates that:
- Up to 7.5t – Values have remained stable.
- 5t to 12t – Values for pre-Euro 5 and Euro 5 vehicles have remained stable for most derivatives, with the exception of Euro 5 Isuzu and Mitsubishi examples where values have seen a slight increase. Euro 6 values have started to fall as more stock becomes available.
- 13t to 18t – Values for pre-Euro 5 and Euro 5 vehicles have fallen by varying degrees. Euro 6 values also have started to fall as available stock increases.
- Multi-wheel rigid – Values for pre-Euro 5 and Euro 5 vehicles have generally fallen dependent on application with 8x4 tippers and skip loaders being affected the most. Again, Euro 6 values have also started to move down as stocks increase.
- Tractor units – Values of pre-Euro 6 6x2 have mainly declined and Euro 6 values are also beginning to see values fall. 4x2 values have remained pretty stable whilst 6x4 values continue to increase.
- Trailers – Some derivatives have seen slight increases whilst others have fallen. Platform trailer values have been corrected.
7.5t to 12t Vehicles
Pre Euro 6 vehicles have fared better than most Euro 6 vehicles where increasing stocks are giving buyers more purchasing options and therefore values are being affected. Values of Isuzu and Mitsubishi vehicles have seen values increase a little.
Mitsubishi Fuso Canter and Isuzu N75.190’s are readily available at present, mainly due to the ex-Palmer and Harvey fleet where box bodies usually have a walk in centre rear door rather than the usual barn doors or shutter. There is also still a good number of fridges and tippers available from the same manufacturers, some with very low mileages.
A batch of 2011 DAF FA LF45.160 fridges proved popular lots as they appeared for sale. Good specification fridge units and bodies assisted their sales despite each having an additional £100, plus VAT, buyer’s fee. Plenty of other fridges are available mostly of around eight years of age but often undesirable fridge units and poor condition restrict a quick sale. One exception was a 2010 60 plate DAF FA LF45.160 with low mileage and meat rails. It created considerably more interest than that of its peers, as is always the case with meat rails.
Car transporters often provoke competitive bidding and a selection of 12 tonne crew cab tilt and slide vehicles on several chassis proved popular lots as did the 7.5 tonne day cab examples supplied by a well-known contract hire and rental company.
A brand new 2018 registered MAN TGL 12.250 tilt and slide crew cab recovery vehicle has appeared at two auctions but failed to meet the required reserve value. Another Euro 6 vehicle which did sell was a 14 plate DAF FA LF45.180 flat with a HMF 910 crane which made £31,500 at auction.
13t to 18t Vehicles
18 tonne Euro 5 boxes and curtains have appeared in numbers, particularly on DAF FA LF55 chassis. 14 and 15 tonne boxes on the same chassis are also plentiful at present and range in age from around 2009 to 2013. Whilst predominantly day cabs the odd sleeper is available but interest is no greater for the sleepers.
12 plate DAF FA CF65.220 day cab demount chassis cabs fitted with poor quality box bodies remain at auction and are struggling to find buyers, the same as many 15 tonne DAF FA LF55 fridges and 18 tonne DAF FA CF65 fridges. The fridges are primarily from one source and are around eight years old and like their smaller peers their fridge units and condition are restricting quick sales.
A quantity of low mileage 2013 63 plate Iveco Eurocargo 180E25 tippers failed to sell as they appeared. Despite their low mileage they were not the smartest examples for their age and because values for such vehicles are in decline they are currently failing to meet the vendor’s expectations.
The same vendor supplies a good section of utility vehicles into auction on a regular basis, often with low kilometres, but as the majority are from utility operators they are usually not in the best condition. The occasional gem does appear and then interest is significantly increased.
A vehicle which created strong interest and bidding was a very tidy 2016 65 plate DAF LF220 day cab flat with a rear mounted Palfinger 18002-EH crane and only 3,000 kilometres. Bidding quickly surpassed the reserve value and the vehicle eventually sold for £64,000.
Multi-wheelers
In general there has been a further decreases in values in this sector especially for tippers and hook-loaders. It affects most manufacturers but not all as a couple of marques have seen values improve a little.
Several beavertail and cheesewedge flats with hefty cranes have appeared for sale on a variety of chassis and of varying ages. One example being a 05 plate Scania P340 6x2 sleeper cab flat with a Fassi F420XP crane and long MOT. Being a tidy example it achieved a bid of £27,250.
A selection of 6x2 dropsides with cranes attached, on a choice of chassis, have appeared at various auctions. Often these vehicles prompt good bidding but as many of the vehicles were over seven years old, below standard and with the crane types and mounting positions affecting their desirability, most failed to attract sufficient attention to result in a sale.
Boxes and fridges provoked reasonable interest, curtains more so, but refuse vehicles continue to find it difficult to attract realistic bids and with the occasional exception they often sell for much less than their true value.
A couple of 2006 Mercedes-Benz cement mixers failed to attract sufficient interest when they appeared at auction despite their tidy appearance.
Tractor Units
More Euro 6 6x2 examples are appearing by the week which is having a negative effect on values. Recently DAF CF and XF’s, Mercedes-Benz Actros, Renault T series, and Volvo FH’s have appeared in quantities sufficient to affect sales values.
A fall in Euro 6 values has repercussions for Euro 5 values where lots of fleet specification 6x2 mid-lift tractor units remain available. 4x2 example are less common and there are currently insufficient Euro 6 examples available for values to be affected. However, as more become available values will possibly suffer the same fate as their 6x2 sisters.
A good selection of tidy 2007 and 2008 DAF FT CF75.310 4x2 day cabs and Scania P310 and P320 4x2 day cabs have appeared recently. The Scania’s fared particularly well with most selling at the first attempt, but the DAF’s failed to meet with sufficient interest to secure a sale. That aside, sales of 4x2 vehicles have fared reasonably well recently.
A trio of 2014 4x2 Euro 6 left hand drive Volvo FH 460 Globetrotter low rides failed to sell when they appeared for sale but it is understood that a deal was agreed post sale. Low rides are common in Europe but less so in the UK with only certain sectors preferring them. For theatre and stage freight companies low rides are the preferred type as hand-balling equipment from the back of a low height trailer is far easier.
An unusual vehicle at auction was a 08 plate Iveco Stralis 440 8x4 sleeper cab with a PM 85026 SP crane. It had three rear axles where a steer axle followed the two drive axles. It has appeared twice to date and on the last occasion a bid of £22,500 failed to secure it on the day.
Another unusual offering was a 1979, (T suffix), Volvo F12 6x4 sleeper to STGO Cat 3 specification and with wet kit. The vehicle had obviously had money spent on it as it was very good condition and an offer of £19,000 reflected such. However it failed to sell and when it reappeared it achieved a higher bid but no gavel.
Trailers
Boxes and curtains have performed well recently along with fridges and values have increased. Skeletals and platforms remain steady but tippers have seen values fall.
As always, as long as a trailer is ready for work it will always receive more attention than those needing any rectification work and usually age is not always a barrier to a sale.
A batch of 2003 12.8 metre double deck boxes from a high street retailer all sold upon appearing. Older double deck trailers rarely sell for any greater value than a similar single deck example and those lacking full length loading on both floors they are likely to sell for less than a single deck box.
Double deck curtains are also currently proving popular but where the lower deck sits between the axles it renders them of little use to general haulage operations and the values of these are diminished in relation to straight frames.

