
With the possible exception of Thursday the 14th July (the day after England’s defeat against Croatia) neither the football nor the heatwave appeared to put off regular auction-goers as it was business as usual at the sales we attended around the UK last month. As the full-time whistle blew on our research for July, the number of recorded sales was down by only 27 compared to the same period last month. Professional buyers were clearly out in force and buying-up stock which is a testament to the continuing strength of the used LCV retail market.
Unfortunately the same can’t be said of the new LCV market, as we head into the second half of the year. Having grown substantially year on year between 2010 and 2015, apart from 2012 when we slipped back into recession for a couple of months, the SMMT are currently forecasting around 359,000 new LCV registrations by the end of 2018. That’s around 3,150 behind last year and, if they are correct in their assumptions, and they usually are, we will have seen new vehicle registrations fall for three consecutive years.
New LCV Registration History
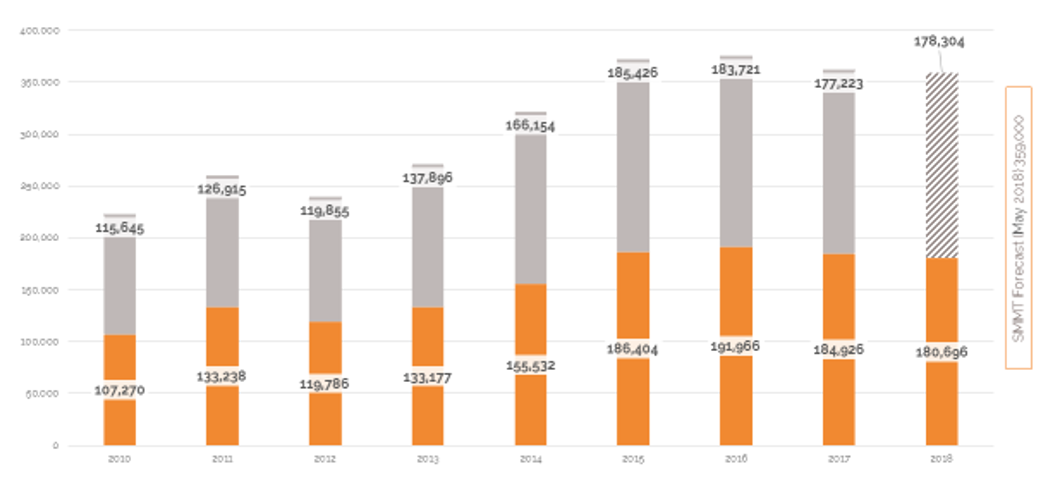
If retail demand for used LCVs continues at the same rate the market could face a significant deficit in supply to the trade as we progress onwards through this year and into 2019.
The same could have been said about this year of course but you never know what’s around the corner. When the news broke that Carillion had collapsed in January there were fears that used prices would plummet as large numbers of used LCVs flooded the market. Then in March we learned that the administrators had been called in at TOM Vehicle Rental fuelling further speculation of over-supply. Whilst auction houses certainly faced some challenges which were largely down to condition and duplication of some models, by and large the market seems to be clearing and used LCV prices remain strong. It seems that if there is a supply crisis looming then here has been a stay of execution in the shape of these unexpected large de-fleets bolstering stock levels.
Supply Trend: Auction Catalogue Entries
Aug-17
Sep-17
Oct-17
Nov-17
Dec-17
Jan-18
Feb-18
Mar-18
Apr-18
May-18
Jun-18
Jul-17
Auction Entries % Var
-2%
-25%
19%
5%
-1%
2%
6%
-16%
-9%
25%
-3%
3.6%
Average age (Months)
61
59
60
61
58
59
60
61
64
63
61
60
Average Mileage
73,821
72,201
73,283
76,195
72,451
72,318
74,589
75,676
76,127
75,780
74,631
76,993
Analysis of the auction sale catalogues revealed that July auction entries were down by 3.6%. The average age of vehicles decreased from 61 months to 60 Months whilst the average recorded mileage increased from 75,631 to 76,993.
Trade Sales vs. Auction Catalogue Entries
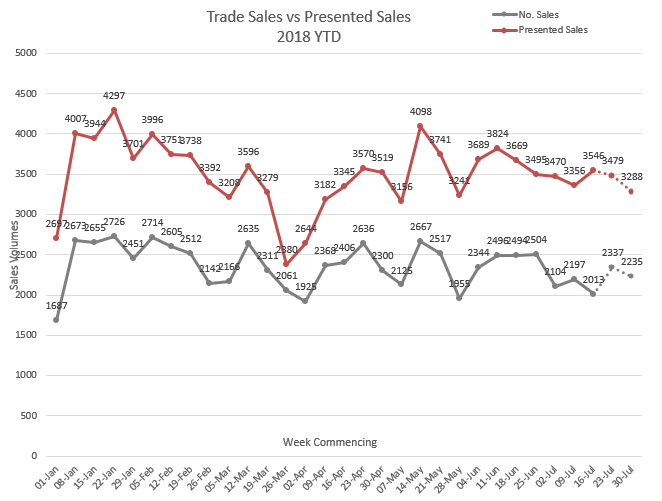
With the summer holiday season in full swing by the time this edition of Red Book goes live and the likelihood of the hot weather continuing throughout August we would normally expect the traditional seasonal slowdown of the market until around the second week in September. However, as the chart below clearly illustrates, that didn’t happen last year nor the year before so we have no reason to suspect anything different will happen this year.
Trade Sales 2016 - 2018
Sales Performance by Sector
May 2018
June 2018
July 2018
LCV Sector
Market Share
Performance
Market Share
Performance
Market Share
Performance
City Van
3.81%
101.58%
4.44%
98.97%
4.37%
100.13%
Small Van
24.54%
103.17%
22.82%
101.85%
24.83%
101.09%
Medium Van
29.73%
101.33%
30.92%
99.67%
31.40%
99.69%
Large Van
17.87%
100.75%
17.49%
98.31%
17.65%
98.82%
Over 3.5T
0.25%
103.45%
0.27%
101.11%
0.31%
102.91%
4x4 Pick-up Workhorse
2.60%
100.30%
2.56%
97.77%
1.65%
95.53%
4x4 Pick-up Lifestyle SUV
11.72%
99.98%
12.36%
98.97%
12.35%
98.20%
Forward Control Vehicle
0.08%
103.80%
0.13%
98.66%
0.24%
91.57%
Chassis - Derived
6.76%
100.03%
6.46%
100.16%
5.13%
98.50%
Mini-bus
0.85%
102.77%
0.80%
100.53%
0.49%
101.45%
Vat Qualifying
1.66%
95.75%
1.65%
97.24%
1.42%
99.28%
Total Market
100.00%
101.34%
100.00%
99.76%
100.00%
99.58%
Whilst the overall price performance was less than .5% behind the Red Book, as always, there were winners and losers. Most significant in terms of our research data volumes and indicative of the current market trends were City Van and Small Van sectors which continue to outperform the guide values. Following closely behind was Medium Van which commands the largest sector share at 31.4%. It was noted from our observations at auctions that 4x4 Pick-ups were proving the most difficult to sell and this is borne out in the research data with Workhorse models achieving around 95.5% and Lifestyle models only achieving 98.2%.
Summary of Guide Price Movements in this edition
The following table illustrates in monetary terms as well as percentages the average price adjustments made for each sector in this edition of Red Book. These are based on a three year vehicle with an average mileage of 60,000. The guide values in Red Book are set against the registration plates that are available for each model and the values published each month reflect the average prices that trade buyers are willing to pay for vehicles on those plates. Amongst the many other factors that might influence their purchasing decisions, are that each of the guide prices on each plate is one month older compared to the Red Book guide values for the previous month. So when looking at the average guide price movements in this table it’s worth considering that any downward price movement also includes an element of age depreciation.
|
August: LCV Used Guide Price Movements 3 year / 60k |
||
|
LCV Sector |
Average % Movement |
Average £ Movement |
|
City Van |
-1.2% |
-£41 |
|
Small Van |
-0.4% |
-£20 |
|
Medium Van |
-1.0% |
-£98 |
|
Large Van |
-1.6% |
-£143 |
|
Over 3.5T |
-1.1% |
-£123 |
|
4x4 Pick-up Workhorse |
-3.4% |
-£390 |
|
4x4 Pick-up Lifestyle SUV |
-0.6% |
-£65 |
|
Forward Control Vehicle |
-3.0% |
-£348 |
|
Chassis - Derived |
-0.9% |
-£89 |
|
Mini-bus |
3.2% |
£322 |
|
Vat Qualifying |
-1.0% |
-£111 |
Updated - Vehicle Colour/Price Guide
Whilst auction catalogue entries always specify colour, it’s the guide values of White vans that you will see printed in the auction catalogues.
White remains the colour choice for most new LCV buyers, however, increasingly we are seeing more and more vans in other colours entering the used wholesale market. The chart below is intended as a guide to illustrate how more or less in percentage terms you would expect to pay for a vehicle in any of the colours listed. For example, if you were bidding on a Silver van in the City Van sector you can expect to pay on average 1.80% more than you’d pay for the same van in White. The values shown in this table are based on actual trade sales of vehicles at open auctions and that at any given time the market values of vehicles are dependent on many other factors such as supply volume and condition.
|
Colours |
City Van |
Small Van |
Medium Van |
Large Van |
4x4 Workhorse |
4x4 |
Mini-bus |
VAT Qualifying |
|
White |
cap Average |
cap Average |
cap Average |
cap Average |
cap Average |
cap Average |
cap Average |
cap Average |
|
Silver |
1.80% |
3.32% |
2.64% |
4.53% |
1.18% |
1.04% |
-1.07% |
1.73% |
|
Blue |
-0.54% |
0.01% |
2.29% |
0.29% |
1.06% |
0.87% |
-1.75% |
1.39% |
|
Black |
3.68% |
4.56% |
3.69% |
3.57% |
2.19% |
0.84% |
4.00% |
|
|
Grey |
4.65% |
5.30% |
4.15% |
3.52% |
2.20% |
1.23% |
4.42% |
|
|
Red |
0.78% |
-0.51% |
1.81% |
-1.58% |
0.96% |
0.07% |
1.90% |
|
|
Yellow |
-3.69% |
-3.90% |
-6.37% |
-7.74% |
||||
|
Green |
-1.50% |
-3.05% |
-2.98% |
-2.31% |
1.56% |
0.16% |
4.68% |
|
|
Orange |
-1.14% |
5.88% |
1.11% |
1.18% |
||||
|
Brown |
1.33% |
1.59% |
-1.26% |
Top 10 models driving the used LCV Market
The Top 10 tables below gives you a clear picture of the makes and models in the main LCV sectors that are driving prices in the used LCV Market. Arranged in order of their respective share of total sector sales, the percentage CAP performance is based on actual recorded sales at open auctions.
Since our guide values reflect the market prices of basic vans in plain white as they appear in the vehicle manufacturer’s price lists, some of guide price movements you might see in this edition may not correlate directly with the sales performances shown in the tables since these include vehicles in all colours and specifications.
|
CAPId |
City Van |
Sector Share |
%CAP |
%CAP White Only Condition Adjusted |
||||||||||||||
|
24231 |
BIPPER DIESEL - 1.3 HDi 75 S Plus Pack [SLD] [non Start/Stop] |
9.43% |
99.1% |
100.5% |
||||||||||||||
|
24217 |
NEMO DIESEL - 1.3 HDi Enterprise [non Start/Stop] |
5.71% |
90.8% |
93.8% |
||||||||||||||
|
26324 |
FIESTA DIESEL - 1.5 TDCi Van |
5.14% |
106.3% |
99.2% |
||||||||||||||
|
21886 |
CORSAVAN DIESEL - 1.3 CDTi 16V 95ps ecoFLEX Van [Start/Stop] |
4.86% |
99.1% |
98.1% |
||||||||||||||
|
24216 |
NEMO DIESEL - 1.3 HDi LX [non Start/Stop] |
4.86% |
87.9% |
88.8% |
||||||||||||||
|
26328 |
FIESTA DIESEL - 1.6 TDCi Sport Van |
4.57% |
106.0% |
103.7% |
||||||||||||||
|
26326 |
FIESTA DIESEL - 1.6 TDCi ECOnetic Van |
4.29% |
96.6% |
94.0% |
||||||||||||||
|
30871 |
TRANSIT COURIER DIESEL - 1.5 TDCi Trend Van |
3.71% |
105.3% |
102.3% |
||||||||||||||
|
30873 |
TRANSIT COURIER DIESEL - 1.6 TDCi Trend Van |
3.71% |
108.3% |
103.1% |
||||||||||||||
|
24233 |
BIPPER DIESEL - 1.3 HDi 75 Professional [non Start/Stop] |
2.86% |
96.6% |
94.3% |
||||||||||||||
|
With an overall sector sales performance of 100.13% this was another strong month for the City Van sector, however, after taking into account colour and condition, for the majority of plain white vehicles in this sector market prices were down by around 1%.
The price performance of Nemo fell considerably last month and seemed to have naturally gravitated towards the prices of its badge-engineered cousins Bipper and Fiorino. We took this opportunity to realign the guide prices in this edition reflecting the long term trends.
Vauxhall Astravan struggled to achieve the guide values and even though many examples presented for sale looked tired and below average condition the average market prices was down by around 5%.
The guide values for most models in this sector have gone down by 1% with the following notable exceptions…
|
||||||||||||||||||
|
CAPId |
Small Van |
Sector Share |
%CAP |
%CAP White Only Condition Adjusted |
||||||||
|
18445 |
BERLINGO L1 DIESEL - 1.6 HDi 625Kg Enterprise 75ps |
15.22% |
104.4% |
102.4% |
||||||||
|
22438 |
PARTNER L1 DIESEL - 850 1.6 HDi 92 Professional Van |
3.95% |
99.1% |
99.6% |
||||||||
|
11464 |
COMBO DIESEL - 1700 1.3CDTi 16V Van [75PS] |
2.65% |
60.2% |
94.9% |
||||||||
|
26689 |
TRANSIT CONNECT 200 L1 DIESEL - 1.6 TDCi 115ps Limited Van |
2.55% |
109.9% |
108.0% |
||||||||
|
26680 |
TRANSIT CONNECT 210 L2 DIESEL - 1.6 TDCi 95ps ECOnetic Van |
2.33% |
112.6% |
105.6% |
||||||||
|
16514 |
TRANSIT CONNECT 230 LWB DIESEL - High Roof Van TDCi 90ps |
1.90% |
92.1% |
99.8% |
||||||||
|
18446 |
BERLINGO L1 DIESEL - 1.6 HDi 850Kg Enterprise 90ps |
1.84% |
101.4% |
101.7% |
||||||||
|
26630 |
KANGOO DIESEL - ML19dCi 75 eco2 Van |
1.52% |
96.9% |
95.7% |
||||||||
|
30768 |
NV200 DIESEL - 1.5 dCi Acenta Van |
1.46% |
100.8% |
96.5% |
||||||||
|
20710 |
CADDY MAXI C20 DIESEL - 1.6 TDI BlueMotion Tech 102PS Van |
1.46% |
107.4% |
106.8% |
||||||||
|
With a sector market share of 24.83% the Small Vans makes up the second largest sector in the used LCV market and July was yet another strong month. Citroen’s Berlingo dominated this sector with two models in the Top 10 accounting for over 17% of the sector’s total sales. A downward market price movement of 1% has been applied to most models in this sector with the following notable exceptions…
|
||||||||||||
|
CAPId |
Medium Van |
Sector Share |
%CAP |
%CAP White Only Condition Adjusted |
||||||||||||||||||||||||
|
25441 |
TRANSIT CUSTOM 270 L1 DIESEL FWD - 2.2 TDCi 125ps Low Roof Limited Van |
5.07% |
99.2% |
99.0% |
||||||||||||||||||||||||
|
18442 |
DISPATCH L1 DIESEL - 1000 1.6 HDi 90 H1 Van Enterprise |
3.71% |
103.7% |
102.1% |
||||||||||||||||||||||||
|
25437 |
TRANSIT CUSTOM 270 L1 DIESEL FWD - 2.2 TDCi 100ps Low Roof Van |
3.39% |
97.0% |
96.1% |
||||||||||||||||||||||||
|
31668 |
VIVARO L2 DIESEL - 2900 1.6CDTI 115PS H1 Van |
2.58% |
93.0% |
92.9% |
||||||||||||||||||||||||
|
31669 |
VIVARO L2 DIESEL - 2900 1.6CDTI 115PS Sportive H1 Van |
2.53% |
95.6% |
95.9% |
||||||||||||||||||||||||
|
26571 |
TRANSIT CUSTOM 290 L1 DIESEL FWD - 2.2 TDCi 100ps Low Roof Van ECOnetic |
2.26% |
101.2% |
91.6% |
||||||||||||||||||||||||
|
25475 |
TRANSIT CUSTOM 290 L2 DIESEL FWD - 2.2 TDCi 125ps Low Roof Limited Van |
2.26% |
97.2% |
98.8% |
||||||||||||||||||||||||
|
25446 |
TRANSIT CUSTOM 290 L1 DIESEL FWD - 2.2 TDCi 100ps Low Roof Van |
1.99% |
100.8% |
99.0% |
||||||||||||||||||||||||
|
25440 |
TRANSIT CUSTOM 270 L1 DIESEL FWD - 2.2 TDCi 125ps Low Roof Trend Van |
1.95% |
100.0% |
99.2% |
||||||||||||||||||||||||
|
25450 |
TRANSIT CUSTOM 290 L1 DIESEL FWD - 2.2 TDCi 125ps Low Roof Limited Van |
1.76% |
98.3% |
95.6% |
||||||||||||||||||||||||
|
With a sector market share of 31.40% Medium Van is the largest sector in terms of the research evidence we gather each month and the sheer volume that are sold each month tends to be indicative of the used LCV market is performing as a whole. After taking into colour, condition and month on month age depreciation, a downward market movement of -1% has been applied to all model ranges in this sector with the following notable exceptions.
|
||||||||||||||||||||||||||||
|
CAPId |
Large Van |
Sector Share |
%CAP |
%CAP White Only Condition Adjusted |
||||||||||||||||||||||||||
|
9104 |
TRANSIT 260 SWB DIESEL FWD - Low Roof Van TDCi 85ps |
3.41% |
83.5% |
98.2% |
||||||||||||||||||||||||||
|
31217 |
RELAY 35 L3 DIESEL - 2.2 HDi H2 Van 130ps Enterprise |
3.34% |
95.0% |
98.9% |
||||||||||||||||||||||||||
|
26863 |
SPRINTER 313CDI LONG DIESEL - 3.5t High Roof Van |
3.34% |
93.0% |
94.3% |
||||||||||||||||||||||||||
|
30637 |
TRANSIT 350 L3 DIESEL RWD - 2.2 TDCi 125ps H3 Van |
3.13% |
94.0% |
97.0% |
||||||||||||||||||||||||||
|
9541 |
SPRINTER 313CDI MEDIUM DIESEL - 3.5t High Roof Van |
2.45% |
91.9% |
91.8% |
||||||||||||||||||||||||||
|
31707 |
BOXER 335 L3 DIESEL - 2.2 HDi H2 Professional Van 130ps |
2.25% |
98.2% |
95.1% |
||||||||||||||||||||||||||
|
22129 |
TRANSIT 280 SWB DIESEL FWD - Low Roof Van TDCi 100ps |
1.98% |
95.2% |
95.0% |
||||||||||||||||||||||||||
|
9155 |
TRANSIT 280 SWB DIESEL FWD - Low Roof Van TDCi 85ps |
1.98% |
80.2% |
96.6% |
||||||||||||||||||||||||||
|
27306 |
SPRINTER 313CDI MEDIUM DIESEL - 3.5t High Roof Van |
1.84% |
100.3% |
99.1% |
||||||||||||||||||||||||||
|
30646 |
TRANSIT 350 L4 DIESEL RWD - 2.2 TDCi 125ps H3 Van |
1.63% |
97.0% |
100.7% |
||||||||||||||||||||||||||
|
At 98.82% the average price performance of large vans was just over 1% behind Red Book. After taking into account colour and condition this has resulted in a downward market price movement of 1% in this edition with the following notable exceptions.
|
||||||||||||||||||||||||||||||
|
CAPId |
4x4 Pick-up Lifestyle SUV |
Sector Share |
%CAP |
%CAP All Colours Condition Adjusted |
||||||||||||
|
35006 |
RANGER DIESEL - Pick Up Double Cab Wildtrak 3.2 TDCi 200 Auto |
6.63% |
100.1% |
100.1% |
||||||||||||
|
35005 |
RANGER DIESEL - Pick Up Double Cab Wildtrak 3.2 TDCi 200 |
4.17% |
97.6% |
97.6% |
||||||||||||
|
21668 |
HILUX DIESEL - Invincible D/Cab Pick Up 3.0 D-4D 4WD 171 |
3.80% |
97.6% |
95.0% |
||||||||||||
|
19137 |
NAVARA DIESEL - D/Cab Pick Up Tekna [Connect] 2.5dCi 190 4WD |
3.31% |
99.9% |
95.5% |
||||||||||||
|
22418 |
RANGER DIESEL - Pick Up Double Cab Wildtrak 3.2 TDCi 4WD |
2.94% |
103.4% |
103.4% |
||||||||||||
|
19135 |
NAVARA DIESEL - Double Cab Pick Up Tekna 2.5dCi 190 4WD |
2.82% |
100.5% |
100.5% |
||||||||||||
|
18623 |
L200 LWB LB DIESEL - Double Cab DI-D Barbarian 4WD Auto 176Bhp |
2.82% |
98.4% |
97.0% |
||||||||||||
|
18622 |
L200 LWB LB DIESEL - Double Cab DI-D Barbarian 4WD 176Bhp |
2.82% |
104.5% |
103.5% |
||||||||||||
|
22419 |
RANGER DIESEL - Pick Up Double Cab Wildtrak 3.2 TDCi 4WD Auto |
2.58% |
100.3% |
99.0% |
||||||||||||
|
34128 |
L200 LWB SPECIAL EDITIONS - Double Cab DI-D Challenger 4WD |
2.45% |
99.7% |
99.7% |
||||||||||||
|
At first glance the 98.2% seems a reasonable price performance for Lifestyle Pick-Ups considering the plates we valued last month are now a month older and it isn’t exactly the best time of year for 4x4 Pick-up sales. Closer examination of our Research Date though revealed there were trends on certain models we needed to address in this edition. These were… Ford Ranger - Limited models only – consistently – guide down by 2% Nissan Navara - Acenta models only – guide down by 3% Toyota Hi-Lux - automatics only - consistently over-performing – guide up 2%
Otherwise a downward market movement of -1% has been applied to most of the other models in this sector with the following notable exceptions…
|
||||||||||||||||
|
CAPId |
4x4 Pick-up Workhorse |
Sector Share |
%CAP |
%CAP All Colours Condition Adjusted |
||||||||||||||||||||||||||||||||||
|
30784 |
HILUX DIESEL - Active D/Cab Pick Up 2.5 D-4D 4WD 144 |
10.00% |
93.7% |
93.7% |
||||||||||||||||||||||||||||||||||
|
21665 |
HILUX DIESEL - HL2 D/Cab Pick Up 2.5 D-4D 4WD 144 |
8.46% |
94.8% |
98.6% |
||||||||||||||||||||||||||||||||||
|
22413 |
RANGER DIESEL - Pick Up Double Cab XL 2.2 TDCi 150 4WD |
6.15% |
84.4% |
93.9% |
||||||||||||||||||||||||||||||||||
|
38351 |
HILUX DIESEL - Active D/Cab Pick Up 2.4 D-4D |
6.15% |
87.4% |
89.5% |
||||||||||||||||||||||||||||||||||
|
29907 |
DISCOVERY DIESEL - XS Commercial Sd V6 Auto |
5.38% |
93.3% |
93.3% |
||||||||||||||||||||||||||||||||||
|
21676 |
DISCOVERY DIESEL - Commercial Sd V6 [255] Auto |
3.85% |
93.0% |
104.9% |
||||||||||||||||||||||||||||||||||
|
18668 |
L200 LWB LB DIESEL - Double Cab DI-D 4Work 4WD 134Bhp [2010] |
3.85% |
103.9% |
98.6% |
||||||||||||||||||||||||||||||||||
|
16756 |
HILUX DIESEL - HL2 2010 D/Cab Pick Up 2.5 D-4D 4WD 144 |
3.85% |
102.4% |
102.6% |
||||||||||||||||||||||||||||||||||
|
16571 |
RANGER DIESEL - Pick Up Double Cab XL 2.5 TDCi 4WD |
3.08% |
83.3% |
97.8% |
||||||||||||||||||||||||||||||||||
|
35425 |
NP300 NAVARA DIESEL - Double Cab Pick Up Visia 2.3dCi 160 4WD |
3.08% |
86.2% |
95.2% |
||||||||||||||||||||||||||||||||||
|
With as market share of 1.65%, which was down on last month by just under 1%, sales volumes remain relatively low for this sector. The average price performance was running at just under 5% behind Red Book at 95.3%. Whilst the majority of model ranges have had a downward market price movement of 1% applied to them there are a substantial number of exceptions that have had individual price adjustments as listed below.
|
||||||||||||||||||||||||||||||||||||||
HGV MARKETPLACE
Auction attendances have increased recently, sales have done likewise, and whilst auction stock is currently high it is now selling again. However, older vehicles are beginning to stick with their poor condition, little export activity and impending clean air zones not aiding them which will mean they could be around for a while.
The number of Euro 6 rigid vehicles appearing at auction continues to increase and significant batches were recently offered by the Fleet Auction Group and Manheim. The former produced a bumper crowd and bidding on the vehicles was competitive with most vehicles selling on the day. The latter is a little more difficult to monitor due to their on-line only presence, however it does appear that most sold. Euro 6 tractor units were also available in these sales but as these are becoming widely available sales were not as brisk as the rigids.
Stock from the failed Palmer and Harvey operation continues to appear at auctions along with a plentiful supply of red boxes, all over ten years old. Fridges are everywhere at present with all weight ranges and most manufacturer’s chassis being available and whilst some are of sub-standard quality and are struggling to find new homes there are few nice ones which are very quickly cherry-picked. There has also been a reasonable smattering of vehicles from the failed TOM Vehicle Rental available of late.
We are beginning to see some clarity in regard to clean air zones, previously referred to as ultra-low emission zones. It is becoming evident that such zones will require a minimum standard of Euro 6 emissions for HGV’s, which the government hopes will help remove the most polluting vehicles from the roads. At the same time government is also actively encouraging operators to change their fleets to Euro 6 by significantly increasing the HGV Road User Levy on pre-Euro 6 vehicles next February.
Wanting to clean up the environment is an admiral cause, but HGV’s, which along with buses and coaches, reportedly account for under 10% of NOx emissions, but they are viewed as an easy target. This is all very well but there is insufficient supplies of used Euro 6 vehicles, together with long build times for new stock, so even if operators wanted to update their fleets within the required time-frames they will find it difficult and expensive to do so.
It could also kill the values of Euro 5 vehicles, many of which are only a few years old and with the average life span of a HGV being around 12 years, (according to the Road Haulage Association), many still have plenty of life left in them but will legislation kill them off along with some smaller operators some of whom will doubtless experience challenges as to their financial viability.
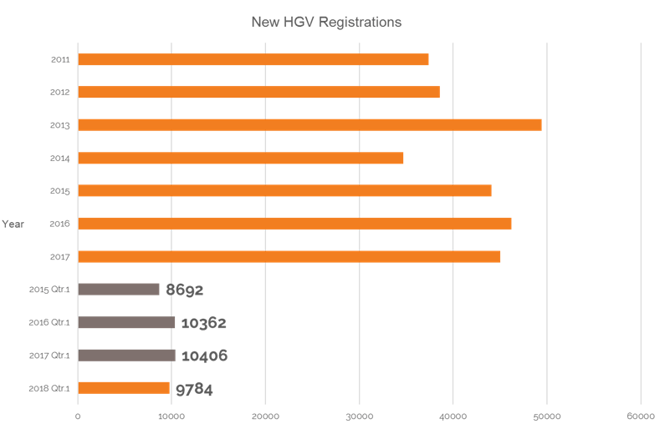
A fall in new HGV registrations is to be reported. The latest SMMT figures, (May 2018), records that vehicles of 16 tonnes and over are down by over 10% year to date compared to 2017. 2017 itself was around 2.5% lower than 2018. Brexit uncertainty is being blamed for the lack of investment in new vehicles. The SMMT no longer provide monthly HGV registration data so we tend to obtain registration information much later than was previously the case.
A summary of new HGV registrations for the last seven years, together with the first quarter details for this and the previous three years, is illustrated below:
Dealers report that business remains steady and with increased requests for Euro 6 products, the difficulty is finding suitable vehicles at the right price. Manufacturers report continued healthy sales which currently includes plenty of Euro 5 stock being sold and returning late plate rigid vehicles can often be pre-sold prior to its arrival into stock.
Traders inform us that they are struggling to move older equipment and one told us he is actively looking at updating the age and quality of the stock currently held, but as he says, ‘What do I do with the old stuff?’ which, without a profitable outcome will stop his aspirations in its tracks.
Records from our auction visits indicate that the average number of auction entries increased significantly last month, an increase of 24%, whilst the number of on-the-day sales of trucks also increased in relation to total entries by almost 9%. Trailer sales increased significantly by over 25%. These figures tend to confirm that the previous months sluggish sales has led to a build-up of stock, but increased sales this month are going some way in helping the situation, however fresh stock now seems to be in shorter supply so we may soon see a return to more normal activity.
This is based on six auction visits and a total of 978 viewed lots and as we always say, these are ‘hammer sales’ on-the-day and converted provisional sales are not included. One auction reports that the conversion rate of provisional sales has again decreased, this time to around 50% which is another drop from last month which was around 65%.
This month’s research indicates that:
- Up to 7.5t – Values continue to decline.
- 5t to 12t – Except for Euro 6 derivatives values have again fallen a little across all body types but especially fridges.
- 13t to 18t – Here too values have decreased a little across all emission levels.
- Multi-wheel rigid – Values are little changed with the exception of some hook loaders and tippers which have decreased slightly.
- Tractor units – 4x2’s have seen little change but 6x2’s have seen some values increased slightly whilst others have reduced a little.
- Trailers – A mixed bag here as values have increased for fridges, skeletals and tippers. Box values have fallen a little and values for most other types remain steady.
7.5t to 12t Vehicles
Further selections of late registered Euro 5 and Euro 6 low mileage 7.5t boxes and curtains have appeared at various auctions. Predominantly Iveco Eurocargo 76E16’s, Mercedes-Benz Atego 816’s and Mitsubishi Fuso Canter’s, with a few DAF’s thrown in for good measure. They attracted competitive bidding and with them being desirable vehicles most sold at the first attempt.
A couple of the latest examples were a pair of 17 plate DAF LF 210 12 tonne boxes, the highest mileage of the pair being just 24,000 kilometres. Both sold on the day after prolonged bidding.
Older vehicles are changing hands but values are being put under pressure. Tippers are readily being traded whilst fridges, which are plentiful at present, together with boxes are not moving on so quickly. Curtains remain scarce by comparison and are finding buyers more easily when they do appear.
A number of sleeper cab vehicles have been noted recently and whilst sleeper cabs in this sector do not necessarily attract any additional attention and often the opposite is true as sleepers generally have higher mileages. However, one that did arouse interest was a 2015 65 plate 12 tonne DAF LF 180 box. The vehicle had sold earlier in the year at the same auction to a DAF agent and it has reappeared at auction recently. Bidding was considerably lighter than it was several months ago, so if the original buyer is attempting to recoup his outlay he may be disappointed.
A selection of car transporters provoked strong bidding with double deck variants attracting most interest, although tilt and slide vehicles remain popular. However, strong bidding doesn’t always result in a sale.
Manual gearbox Isuzu and Mitsubishi vehicles are being traded but more numerous automatic gearbox versions are finding it much more difficult in finding buyers.
Unusual vehicles continue to attract attention but an exception was a 2014 64 plate Mercedes-Benz Atego 818 Coring unit with 30,000 kilometres has appeared on several sales without success.
13t to 18t Vehicles
Here too we have seen batches of late registered Euro 5 and Euro 6 low mileage 18t boxes, curtains and fridges appearing at various auctions. Most are Mercedes-Benz 1824’s with a mix of both day and sleeper cabs and day cab DAF LF 250’s. Strong bidding ensued and again most sold on the day.
Older boxes and fridges are currently struggling a little, the latter due to the plentiful supply currently available. Curtains and tippers are less common and tend to attract a little more attention. Any late plate Euro 5 offerings are finding buyers but subject to condition and mileage.
Quality skip loaders remain popular along with gully suckers, sweepers and some specialist utility vehicles are attracting strong interest, however, their high capital cost at new often means that they often have high reserve values resulting in few sales first time around.
Several double deck car carriers have appeared recently, some were tidy examples with reasonable kilometres but with a few exceptions most struggled to command realistic bids.
The 18 plate Iveco Eurocargo 180E25K Multilift skip loader mentioned last month has appeared at further auctions but on each occasion, despite active bidding, the highest offer has been insufficient to reach the reserve value resulting in no sale.
Another vehicle of interest was a 2003 53 plate DAF FA LF55.220 tipper which looked as new and had only 64,000 warranted kilometres. Whether destined for further use or preservation, bidding was strong and it sold for a surprising £6,200.
Multi-wheelers
This is the sector which is seeing very little Euro 6 vehicles on the open market, with the exception of tippers. That said a small batch of Mercedes-Benz Actros 2532 curtains performed well at auction as did a small selection of late registered Euro 5 Mercedes-Benz Axor 2533 fridges.
Generally unless they are late registered, boxes, curtains and fridges are attracting less interest than a few months ago but values remain stable. It is still tippers that command the strongest interest, particularly 8x4 examples with cranes but even here activity is a little subdued and some values are under pressure.
A batch of four Euro 6 Mercedes-Benz Arocs 3248k’s didn’t quite hit the spot, with the exception of the one insulated body example, the others being steel. As insulated examples are scarce by comparison it attracted good interest and sold easily. The remaining three did no better at a subsequent sale. A couple of similar 3240K examples also struggled at a different venue.
Hook-loaders continue to be popular but values for some are in decline and anything thing carrying a crane, (the bigger the better), or can carry plant remain popular lots but unlike tippers age, condition and mileage is much more important.
Refuse trucks, especially kerbside recyclers are currently numerous. 2011 plate Dennis Eagle 6x2 examples garnering bids of just £3,000. The occasional late registered examples do attract a little interest but often sell for less than their true value.
Any type of draw-bar outfit along with car carrier outfits continue to struggle in mustering any real enthusiasm amongst buyers. In fact a couple of car carrier prime movers actually fared much better than complete rigs
A brace of jet-vac tankers prompted some interest but cement mixers, irrelevant of age, chassis or condition failed to provoke any meaningful bids.
Tractor Units
Little change in 4x2 tractor units values where supply is small in comparison to 6x2’s. 6x4 and multi-axle tractor units continue to perform strongly and values reflect this.
There is an increasing number of Euro 6 6x2 examples appearing in the market along with a plentiful supply of Euro 5 and older examples. Euro 6 Mercedes-Benz 2545 Streamspace examples easily outnumber the total of all other manufacturers examples at present. A visit to one auction revealed rows of them parked up awaiting a decision from the owners as to what to do with them. Sales of them are occurring but primarily for those with low kilometres.
Small batches of Volvo FH460 Globetrotters and XF 460 Space cabs met with good interest but here too mileage determined the outcome.
Some Euro 6 values have decreased slightly. Particularly Mercedes-Benz who’s products are plentiful, whilst others have either remained steady or have seen a slight increase dependent on manufacturer and model.
Euro 5 vehicles are having mixed fortunes at the moment. Mercedes-Benz Axors, Renaults and Volvo FH values remain steady. Iveco, MAN and the current model Mercedes-Benz Actros have seen values fall slightly whilst values have increased a little for DAF’s, previous model Mercedes-Benz Actros, Scania’s and Volvo FM’s.
Trailers
Trailer sales have increased recently aided by a large selection of two year old triaxle curtains in clean condition which provoked strong bidding and nearly all sold as they appeared.
Plenty of the most popular types remain available, but stocks have reduced sharply recently and the simple economy of supply and demand is in force so some values have increased for those where supply is falling. Other variants have seen values fall, especially drawbar examples.
The majority of stock remains over ten years old and interest in them is subdued, whereas newer trailers are creating more interest and late examples of most types are selling.
An interesting trailer at auction recently was a tidy 2002 13.8 triaxle Montracon ten stall horsebox with full bathroom, side lockers and on board water tanks. Uniqueness didn’t help it sell and it reappeared at a later sale, with the same result.
Another trailer of interest was a 2010 15.3m Nooteboom four axle machine carrier which sold for £30,000.

