
LCV Market Overview
With the summer holiday season in full swing, unlike the weather, the expected seasonal lull in the used LCV Wholesale market did not disappoint. Whilst most sales were reasonably well attended, auction entries were generally down throughout August as were sales conversion rates.
As always during the main holiday periods, auction attendances were bolstered by retail buyers and their entourages, many of whom were clearly out to bag a bargain as opposed to just shelter from the rain. With no concern over margins and often seen to outbid the trade, these buyers must have been a godsend to some of the vendors as there were times when they were clearly struggling to achieve anywhere near the guide prices.
That said there were still plenty of professional buyers around and some of the more prolific ones were eagerly snapping-up the most desirable vehicles offering some comfort that the used LCV retail market is still alive and doing reasonably well - for some!
However, we couldn’t help but notice that bidding during some of the larger sales was particularly slow and many vehicles did not sell on the day. From a buying perspective, an increasing number of re-entered, duplicated and less desirable vehicles was the most likely cause. By contrast, some of the smaller sale sections with a wider mix of vehicles seemed to fare much better.
It remains to be seen whether demand will pick up in September and this build-up of stock will clear naturally, or, will vendors be forced to reduce their margin aspirations accordingly leading to a fall in market prices.
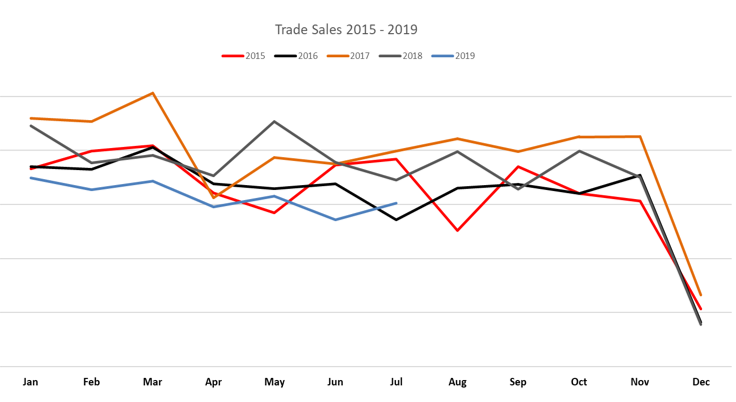
We often refer to the seasonality effect when describing the used LCV Wholesale Market, however, as the monthly sales volume chart shows, it is difficult to pinpoint these effects and determine any kind of repeating pattern over the years. That’s not to say that seasonality no longer exists, clearly it does, particularly at LCV sub-sector levels. For example, the demand for double cab tipper and dropside bodied vehicles tends to decline around late autumn whereas the demand for large volume vans increases in the run up to the Christmas holidays. Arguably though, in recent years seasonality has been masked by some extraordinary socio-economic factors, not least the political turmoil we’ve witnessed since the EU Referendum back in June 2016.
Supply Trend: Auction Catalogue Entries
Sep-18
Oct-18
Nov-18
Dec-18
Jan-19
Feb-19
Mar-19
Apr-19
May-19
Jun-19
Jul-19
Aug-19 MTD
Auction Entries % Var
-25%
25%
-7%
-48%
68%
6%
2%
-8%
28%
-11%
7%
-11%
Average age (Months)
61
60
63
63
59
60
61
62
58
56
59
60
Average Mileage
74,994
75,074
78,883
78,312
75,974
75,974
76,365
77,283
72,114
66,591
70,673
71,411
According to the auction catalogues that we monitor on a daily basis, auction entries for August (month to date) were down by 11% compared to the same period in July. The average age of vehicles presented for sale was up by 1 month to 60 months and the average mileage was up by 738 miles to 71,411 miles. With sale conversion rates in some cases remaining around 50%, inevitably it’s likely that a high proportion of entries are actually vehicles that have failed to sell at previous sales.
Sales Performance by Sector
This chart shows, at sector level, how the market has changed over the past month in terms of market share by sector, and, by sales performance against the guide values. The figures are based on 3 year old vehicles in a reasonable colour at 60,000 miles.
|
June 2019 |
July 2019 |
August 2019 |
||||
|
LCV Sector |
Market Share |
Performance |
Market Share |
Performance |
Market Share |
Performance |
|
City Van |
4.73% |
96.09% |
5.50% |
95.23% |
5.53% |
94.20% |
|
Small Van |
24.06% |
97.58% |
24.77% |
97.27% |
24.97% |
96.50% |
|
Medium Van |
31.02% |
98.08% |
30.72% |
99.19% |
30.03% |
98.37% |
|
Large Van |
17.26% |
96.81% |
16.69% |
98.06% |
15.95% |
98.32% |
|
Over 3.5T |
0.35% |
96.19% |
0.23% |
99.91% |
0.33% |
104.60% |
|
4x4 Pick-up Workhorse |
2.03% |
97.47% |
2.20% |
96.59% |
2.26% |
98.44% |
|
4x4 Pick-up Lifestyle SUV |
12.84% |
96.53% |
12.61% |
97.86% |
14.05% |
97.12% |
|
Forward Control Vehicle |
0.19% |
98.12% |
0.21% |
97.05% |
0.20% |
105.86% |
|
Chassis - Derived |
4.89% |
97.03% |
4.45% |
97.81% |
4.56% |
98.44% |
|
Mini-bus |
0.45% |
97.59% |
0.39% |
104.84% |
0.33% |
100.37% |
|
Vat Qualifying |
1.85% |
98.68% |
1.97% |
99.06% |
1.62% |
100.42% |
|
Total Market |
100.00% |
97.40% |
100.00% |
98.05% |
100.00% |
97.57% |
Average Guide Price Changes by Sector
The average percentage and monetary movements in the table below serves as a guide to the price adjustments we’ve made to the guide values in each sector. The figures shown in this table are based on vehicles in a reasonable colour at 3years / 60,000 miles.
|
July 2019 |
August 2019 |
September 2019 |
||||
|
LCV Sector |
Average % Movement |
Average £ Movement |
Average % Movement |
Average £ Movement |
Average % Movement |
Average £ Movement |
|
City Van |
-1.5% |
-£56 |
-1.6% |
-£60 |
-5.0% |
-£188 |
|
Small Van |
-1.7% |
-£84 |
-2.2% |
-£105 |
-2.4% |
-£119 |
|
Medium Van |
-0.8% |
-£72 |
0.1% |
£6 |
-1.2% |
-£119 |
|
Large Van |
-1.4% |
-£119 |
-2.7% |
-£218 |
-1.3% |
-£106 |
|
Over 3.5T |
-1.0% |
-£120 |
-3.1% |
-£348 |
-1.4% |
-£162 |
|
4x4 Pick-up Workhorse |
-0.2% |
-£22 |
-1.4% |
-£165 |
-0.9% |
-£76 |
|
4x4 Pick-up Lifestyle SUV |
-3.8% |
-£420 |
-2.0% |
-£215 |
-2.4% |
-£267 |
|
Forward Control Vehicle |
-1.0% |
-£114 |
-1.0% |
-£116 |
-0.8% |
-£96 |
|
Chassis - Derived |
-1.1% |
-£107 |
-3.3% |
-£310 |
-1.0% |
-£100 |
|
Mini-bus |
-1.2% |
-£157 |
0.9% |
£111 |
0.3% |
£36 |
|
Vat Qualifying |
-0.8% |
-£100 |
-0.3% |
-£35 |
-1.4% |
-£163 |
Top 10 models in each LCV Sector
The Top 10 tables below give you a clear picture of the makes and models in the main LCV sectors that are driving prices in the used LCV Market. Arranged in order of their respective share of total sector sales, the percentage CAP performance is based on actual recorded sales.
Since our guide values reflect the market prices of basic vans in a reasonable colour as they appear in the vehicle manufacturer’s price lists, some of the guide price movements you might see in this edition may not correlate directly with the sales performances shown in the tables. Also, as part of the process for reviewing guide prices, we take into account condition and the weighting effect that stock availability and sales volume might have on prices.
The commentary contained within the Top 10 Tables is intended to give an overview of any sector level price adjustments we have made in this edition along with specific items of interest noted whilst attending auctions and analysing our sales research data.
We also include an exception list of model ranges which have had individual price adjustments rather than sector-level. The percentage value in brackets at the end of each of the model range names listed in the table indicates any individual price change we’ve made in this edition.
|
CAPId |
City Van |
Sector Share |
%CAP |
%CAP Condition Adjusted |
|
26326 |
FIESTA DIESEL - 1.6 TDCi ECOnetic Van |
12.25% |
93.9% |
96.4% |
|
15140 |
BIPPER DIESEL - 1.4 HDi 70 S |
5.57% |
58.2% |
80.4% |
|
15141 |
BIPPER DIESEL - 1.4 HDi 70 S [SLD] |
5.57% |
57.5% |
83.3% |
|
11121 |
CORSAVAN DIESEL - 1.3 CDTi 16V Van |
5.57% |
79.9% |
91.2% |
|
26324 |
FIESTA DIESEL - 1.5 TDCi Van |
5.12% |
90.8% |
96.1% |
|
24217 |
NEMO DIESEL - 1.3 HDi Enterprise [non Start/Stop] |
4.68% |
91.7% |
91.5% |
|
30869 |
TRANSIT COURIER DIESEL - 1.5 TDCi Van |
4.45% |
89.8% |
94.6% |
|
26328 |
FIESTA DIESEL - 1.6 TDCi Sport Van |
3.79% |
108.4% |
96.3% |
|
21886 |
CORSAVAN DIESEL - 1.3 CDTi 16V 95ps ecoFLEX Van [Start/Stop] |
3.12% |
86.8% |
89.3% |
|
42524 |
TRANSIT COURIER DIESEL - 1.5 TDCi 100ps Limited Van [6 Speed] |
2.90% |
92.9% |
93.1% |
City Vans accounted for just over 5.5% of the total used LCVs sold at auctions last month which is marginally up on last month. Overall the sector under-performed against the guide values by around 6%. This is the third month in succession that market prices have fallen in this sector, -3%, -5% and -6% respectively. On average, the guide values have been dropped by £188 in this edition compared to around £60 per month in the July and August editions respectively.
Fiesta and Corsavan once again dominated this sector in terms of sales volumes and whilst sales performances were down significantly, sport models fared much better; both Fiesta and Corsavan sports model prices are unchanged. Fiorino, Nemo and Bipper values slipped
In addition to -1% applied to all models in this sector to allow for monthly age deprecation, some significant downward price adjustments were necessary in this edition which are listed below.
|
Models |
|
|
CITROEN NEMO (16-18) VAN (-5%) |
FIAT PUNTO (96-05) PET VAN (-5%) |
|
FIAT FIORINO E6 (16- ) VAN (-5%) |
FIAT PUNTO (96-07) VAN (-5%) |
|
FIAT GRANDE PUNTO (07-15) VAN (-5%) |
FORD FIESTA (09-18) VAN (-4%) |
|
MINI CLUBVAN (12-14) VAN (-6%) |
PEUGEOT 206 (00-07) VAN (-5%) |
|
PEUGEOT 207 (07-08) PET VAN (-5%) |
PEUGEOT BIPPER (08-17) VAN (-5%) |
|
PEUGEOT 207 (07-12) VAN (-5%) |
RENAULT CLIO (02-07) VAN (-5%) |
|
PEUGEOT BIPPER (16-18) VAN (-5%) |
CITROEN XSARA (02-05) VAN (-5%) |
|
RENAULT CLIO (07-09) VAN (-5%) |
FORD FIESTA (05-09) PET VAN (-4%) |
|
VAUXHALL ASTRAVAN (06-13) VAN (-11%) |
FORD FIESTA (05-09) VAN (-4%) |
|
VAUXHALL CORSAVAN (07-19) VAN (-11%) |
MG ROVER (03-05) PET VAN (-5%) |
|
CITROEN C2 (05-09) VAN (-5%) |
MG ROVER (03-05) VAN (-5%) |
|
CITROEN NEMO (08-16) VAN (-5%) |
FORD FIESTA (03-05) PET VAN (-4%) |
|
FIAT FIORINO (08-16) VAN (-5%) |
FORD FIESTA (03-05) VAN (-4%) |
|
CAPId |
Small Van |
Sector Share |
%CAP |
%CAP Condition Adjusted |
|
18445 |
BERLINGO L1 DIESEL - 1.6 HDi 625Kg Enterprise 75ps |
7.35% |
94.3% |
95.1% |
|
11465 |
COMBO DIESEL - 2000 1.3CDTi 16V Van [75PS] |
3.34% |
110.3% |
105.5% |
|
18446 |
BERLINGO L1 DIESEL - 1.6 HDi 850Kg Enterprise 90ps |
2.60% |
92.3% |
92.7% |
|
26622 |
KANGOO MAXI DIESEL - LL21dCi 110 Van |
1.98% |
95.4% |
96.5% |
|
24235 |
COMBO L1 DIESEL - 2000 1.3 CDTI 16V ecoFLEX H1 Van |
1.98% |
91.0% |
96.4% |
|
34468 |
PARTNER L1 DIESEL - 850 1.6 HDi 92 Professional Van |
1.75% |
96.1% |
93.9% |
|
18575 |
DOBLO CARGO SWB DIESEL - 1.3 Multijet 16V SX Van Start Stop |
1.64% |
77.5% |
|
|
30768 |
NV200 DIESEL - 1.5 dCi Acenta Van |
1.64% |
97.3% |
96.2% |
|
26672 |
TRANSIT CONNECT 200 L1 DIESEL - 1.6 TDCi 75ps Van |
1.53% |
100.0% |
97.2% |
|
26689 |
TRANSIT CONNECT 200 L1 DIESEL - 1.6 TDCi 115ps Limited Van |
1.47% |
102.8% |
98.2% |
Accounting for 24.97% of all used LCVs sold at auctions last month the sector market share was slightly up on the previous month. The average price performance was down again at 96.5% which is again reflected in the Top 10 models.
A downward price movement of 1% has been applied to most model ranges in this sector to take into account plate-age depreciation, however, there have been some significant downward price adjustments to the following model ranges.
|
Models |
|
|
FORD CONNECT (18- ) T200-T240 VAN FACELIFT (-4%) |
RENAULT KANGOO (08-13) VAN (-3%) |
|
M-B CITAN (13-19) VAN (-4%) |
RENAULT KANGOO COMPACT (08-10) PET VAN (-3%) |
|
CITROEN BERLINGO (16-19) VAN (-4%) |
RENAULT KANGOO COMPACT (08-12) VAN (-3%) |
|
PEUGEOT PARTNER E6 (15-19) VAN (-2%) |
VAUXHALL COMBO (12-18) VAN (-5%) |
|
RENAULT KANGOO (13-17) VAN (-3%) |
FORD CONNECT (02-07) T200 PET VAN (9%) |
|
VW CADDY (15-17) VAN (-5%) |
FORD CONNECT (02-08) T210 PET VAN (9%) |
|
CITROEN BERLINGO (08-18) VAN (-4%) |
FORD CONNECT (02-09) T200-T230 VAN (9%) |
|
FIAT DOBLO CARGO (10-17) VAN (-8%) |
FORD CONNECT (06-07) T210 VAN (9%) |
|
FORD CONNECT (09-13) T200-T230 VAN (-6%) |
VAUXHALL COMBO (01-10) PET VAN (-3%) |
|
PEUGEOT PARTNER (08-17) VAN (-4%) |
VAUXHALL COMBO (01-12) VAN (-3%) |
|
CAPId |
Medium Van |
Sector Share |
%CAP |
%CAP Condition Adjusted |
|
25441 |
TRANSIT CUSTOM 270 L1 DIESEL FWD - 2.2 TDCi 125ps Low Roof Limited Van |
3.71% |
92.8% |
98.1% |
|
31668 |
VIVARO L2 DIESEL - 2900 1.6CDTI 115PS H1 Van |
2.92% |
91.2% |
92.4% |
|
25446 |
TRANSIT CUSTOM 290 L1 DIESEL FWD - 2.2 TDCi 100ps Low Roof Van |
1.81% |
105.8% |
100.8% |
|
25437 |
TRANSIT CUSTOM 270 L1 DIESEL FWD - 2.2 TDCi 100ps Low Roof Van |
1.76% |
96.2% |
96.5% |
|
25475 |
TRANSIT CUSTOM 290 L2 DIESEL FWD - 2.2 TDCi 125ps Low Roof Limited Van |
1.76% |
91.4% |
94.6% |
|
31605 |
TRAFIC LWB DIESEL - LL29dCi 115 Business Van |
1.72% |
88.7% |
93.1% |
|
26570 |
TRANSIT CUSTOM 270 L1 DIESEL FWD - 2.2 TDCi 100ps Low Roof Van ECOnetic |
1.62% |
95.5% |
97.1% |
|
34335 |
VITO LONG DIESEL - 111CDI Van |
1.35% |
91.1% |
87.5% |
|
18442 |
DISPATCH L1 DIESEL - 1000 1.6 HDi 90 H1 Van Enterprise |
1.30% |
91.4% |
94.3% |
|
35807 |
TRANSIT CUSTOM 290 L1 DIESEL FWD - 2.0 TDCi 105ps Low Roof Van |
1.30% |
97.7% |
99.0% |
At just over 30%, the sector market share for Medium Vans was down by just under 1% last month whilst price performance against the guide was also down by around 1.5%.
Whilst these monthly percentage variations may seem quite low it has to be remembered that this is the largest of all the LCV sectors in terms of both the overall LCV parc and used vehicles sold each month at auction.
As the largest sector, we would normally suggest that its overall performance acts as a barometer for the whole of the used LCV wholesale market, however, at the present time this isn’t the case. Mediums Vans, along the Large Van sector, are clearly in greater demand and prices are relatively stronger. Ford Transit Custom continued to dominate the sector and took 6 out of the Top 10 slots last month.
A downward price movement of 1% has been applied to most models in this sector in order to reflect plate-age depreciation, with the following exceptions listed below.
|
Models |
|
|
FORD TRANSIT CUSTOM VAN E6 (17- ) (-2%) |
FIAT SCUDO (07-17) VAN (-4%) |
|
M-B VITO E6 (15- ) CDi VAN (-5%) |
M-B VITO (10-15) CDi VAN (-5%) |
|
PEUGEOT EXPERT E6 (16- ) VAN (-4%) |
M-B VITO (10-15) DUALINER VAN (4%) |
|
RENAULT TRAFIC E6 (16- ) dCi VAN (1%) |
TOYOTA PROACE (12-16) VAN (4%) |
|
TOYOTA PROACE E6 (16- ) FRIDGE VAN (-4%) |
VW T6 TRANSPORTER (15-16) VAN (-6%) |
|
TOYOTA PROACE E6 (16- ) VAN (-4%) |
FORD TRANSIT CUSTOM VAN (12-17) (-2%) |
|
VW T6 TRANSPORTER E6 (16- ) VAN (0%) |
VW T5 TRANSPORTER (10-16) VAN (0%) |
|
VW T6 TRANSPORTER PETROL (16-19) VAN (0%) |
VW T5 TRANSPORTER (03-10) VAN (0%) |
CAPId
Large Van
Sector Share
%CAP
%CAP Condition Adjusted
22135
TRANSIT 280 SWB DIESEL FWD - Medium Roof Van TDCi 100ps
3.24%
112.3%
107.5%
36948
SPRINTER 314CDI LONG DIESEL - 3.5t High Roof Van
3.00%
96.1%
94.2%
33533
MASTER LWB DIESEL FWD - LM35dCi 125 Business Medium Roof Van
2.84%
98.9%
99.5%
26863
SPRINTER 313CDI LONG DIESEL - 3.5t High Roof Van
2.84%
100.5%
96.3%
30624
TRANSIT 350 L3 DIESEL FWD - 2.2 TDCi 100ps H3 Van
2.37%
96.3%
97.8%
30637
TRANSIT 350 L3 DIESEL RWD - 2.2 TDCi 125ps H3 Van
2.13%
93.5%
94.2%
21705
CRAFTER CR35 LWB DIESEL - 2.0 TDI 136PS High Roof Van
2.05%
91.6%
95.8%
31217
RELAY 35 L3 DIESEL - 2.2 HDi H2 Van 130ps Enterprise
1.89%
93.0%
99.2%
41530
CRAFTER CR35 MWB DIESEL - 2.0 TDI 140PS Startline High Roof Van
1.66%
97.3%
96.0%
31707
BOXER 335 L3 DIESEL - 2.2 HDi H2 Professional Van 130ps
1.58%
91.0%
104.7%
The sector market share for Large Vans was down slightly last month at around 16.% whilst price performance remained at around 2% behind the guide at 98.32%.
On average the guide values for vehicles in this sector have gone down by £106 in this edition which is about half the amount we saw in the August edition.
A downward price movement of 1% has been applied to most model ranges in this sector, however, there are large number of exceptions this month which are worth noting.
|
Models |
|
|
CITROEN RELAY E6 (16- ) VAN (4%) |
FIAT DUCATO (06-14) WINDOW VAN (1%) |
|
FIAT DUCATO (19- ) VAN (1%) |
IVECO DAILY (09-15) VAN (-5%) |
|
IVECO DAILY E6 (14- ) VAN (-5%) |
FIAT DUCATO (02-06) VAN (1%) |
|
NISSAN NV400 E6 (16- ) VAN (1%) |
FIAT DUCATO (02-07) VAN (1%) |
|
RENAULT MASTER E6 (16- ) dCi VAN (3%) |
FORD TRANSIT (06-13) T350 - MESSING UNIT (-3%) |
|
RENAULT MASTER E6 (16-) dCi WINDOW VAN (3%) |
FORD TRANSIT (06-14) T330 - T350 VAN (-3%) |
|
RENAULT TRUCKS MASTER E6 (16- ) VAN (3%) |
IVECO DAILY (06-09) VAN (-5%) |
|
FIAT DUCATO (14- ) VAN (1%) |
IVECO DAILY (06-10) 3.5t VAN (-5%) |
|
IVECO DAILY (14-17) VAN (-5%) |
M-B SPRINTER (06-13) 2-SERIES VAN (-2%) |
|
NISSAN NV400 (11- ) VAN (1%) |
M-B SPRINTER (06-13) 3-SERIES VAN (-2%) |
|
FIAT DUCATO (06-14) VAN (1%) |
M-B SPRINTER CNG (09-13) SERIES-3 VAN (-2%) |
CAPId
4x4 Pick-up Lifestyle SUV
Sector Share
%CAP
%CAP Condition Adjusted
35285
L200 DIESEL - Double Cab DI-D 178 Barbarian 4WD Auto
5.33%
101.6%
101.6%
35006
RANGER DIESEL - Pick Up Double Cab Wildtrak 3.2 TDCi 200 Auto
5.02%
91.4%
96.2%
35284
L200 DIESEL - Double Cab DI-D 178 Barbarian 4WD
4.08%
101.5%
101.5%
35282
L200 DIESEL - Double Cab DI-D 178 Warrior 4WD
3.97%
96.1%
96.6%
18623
L200 LWB LB DIESEL - Double Cab DI-D Barbarian 4WD Auto 176Bhp
3.35%
100.4%
97.5%
35433
NP300 NAVARA DIESEL - Double Cab Pick Up Tekna 2.3dCi 190 4WD Auto
3.35%
96.8%
94.7%
39511
NAVARA DIESEL - Double Cab Pick Up Tekna 2.3dCi 190 4WD Auto
3.14%
94.5%
94.5%
39510
NAVARA DIESEL - Double Cab Pick Up Tekna 2.3dCi 190 4WD
3.14%
96.2%
95.1%
18622
L200 LWB LB DIESEL - Double Cab DI-D Barbarian 4WD 176Bhp
3.03%
98.1%
98.6%
35432
NP300 NAVARA DIESEL - Double Cab Pick Up Tekna 2.3dCi 190 4WD
3.03%
99.4%
97.5%
Accounting for just over 14% of all used LCVs sold last month, the average price performance of 4x4 Lifestyle Pick-ups was down again at around 97%. It’s clear from our observations at auctions and analysis of auction sales results that market sentiment in this sector remains at a very low level. In order to reflect this it has been necessary to make some significant adjustments to the guide values in this edition. On average prices have moved down by -2.4% or -£267 (3yr 60K).
The guide values we publish in all sectors are for vehicles as they appear in the vehicle manufacturer’s price list and do not include any allowance for manufacturer options or third party extras. This is particularly relevant in this sector as we continue to see many vehicles presented for sale that have extras fitted to them including lockable load covers or hardtops over the pick-up body which are highly desirable to retail buyers. As we have been witnessing for most of the year, such vehicles were the only ones selling with ease last month, albeit well below the guide values. Standard vehicles with anything more than minor cosmetic damage were largely being ignored by trade buyers, consequently unsold stock levels are increasing.
The guide values for most model ranges in this sector have gone down by 1% to allow for plate age depreciation with the following exceptions.
|
models |
|
|
GREAT WALL (12- ) (-4%) |
FORD RANGER (15-19) PICK-UP LIFE (-4%) |
|
ISUZU D-MAX DIESEL (17- ) (-5%) |
SSANGYONG KORANDO SPORT (12-17) (-4%) |
|
NISSAN NAVARA E6 (16- ) LIFE (-4%) |
SSANGYONG MUSSO E6 (16-19) (-4%) |
|
SSANGYONG KORANDO E6 (16- ) (-4%) |
MITSUBISHI L200 (01-07) TD/TD 113 LIFE (-6%) |
|
SSANGYONG KORANDO SPORT E6 (16-17) (-4%) |
NISSAN NAVARA (10-16) LIFE (-6%) |
|
SSANGYONG MUSSO E6 (18- ) (-4%) |
NISSAN NAVARA (05-07) LIFE (-5%) |
|
VW AMAROK (16- ) LIFE (-3%) |
NISSAN NAVARA (06-10) LIFE (-5%) |
CAPId
4x4 Pick-up Workhorse
Sector Share
%CAP
%CAP Condition Adjusted
22413
RANGER DIESEL - Pick Up Double Cab XL 2.2 TDCi 150 4WD
15.57%
89.7%
93.3%
30784
HILUX DIESEL - Active D/Cab Pick Up 2.5 D-4D 4WD 144
10.18%
103.8%
100.2%
18668
L200 LWB LB DIESEL - Double Cab DI-D 4Work 4WD 134Bhp [2010]
5.99%
103.6%
96.8%
26500
NAVARA DIESEL - Double Cab Pick Up Visia 2.5dCi 144 4WD
5.99%
89.9%
94.1%
29907
DISCOVERY DIESEL - XS Commercial Sd V6 Auto
5.39%
94.7%
96.9%
21665
HILUX DIESEL - HL2 D/Cab Pick Up 2.5 D-4D 4WD 144
5.39%
93.3%
101.3%
24963
D-MAX DIESEL - 2.5TD Double Cab 4x4
4.19%
97.3%
90.9%
11073
DEFENDER 110 LWB DIESEL - Hard Top TDCi
2.99%
68.1%
16571
RANGER DIESEL - Pick Up Double Cab XL 2.5 TDCi 4WD
2.40%
65.4%
93.3%
34428
DISCOVERY DIESEL - SE Commercial Sd V6 Auto
2.40%
105.1%
105.1%
At 2.26% there was very little change in the market share of ‘Workhorse’ pick-ups sold last month whilst the average price performance held reasonably firm at 98.44%. This downward shift in market price is only around 0.5% more than what we would normally expect after taking into account age depreciation. However close analysis of our research data revealed this to be somewhat misleading. Whilst most models under-performed, strong bidding on Toyota Hilux and LR Discovery boosted the overall sector performance.
A downward price movement of just under 1% has been applied to all model ranges in this sector to allow for plate-age depreciation with the following notable exceptions.
|
models |
|
|
MITSUBISHI L200 (15- ) DI-D WORK (-5%) |
FORD RANGER (09-11) CHASSIS (-3%) |
|
MITSUBISHI OUTLANDER (07- ) WORK (-5%) |
FORD RANGER (09-11) PICK-UP WORK (-3%) |
|
TOYOTA HILUX E6 (16- ) WORK (0%) |
FORD RANGER (09-11) TIP (-3%) |
|
FORD RANGER (15-19) CHASSIS PICK-UP WORK (5%) |
MITSUBISHI L200 (04-07) TD/TD 113 WORK (-5%) |
|
ISUZU D-MAX DIESEL (12-18) (-5%) |
TOYOTA HILUX (05-07) D-4D WORK (0%) |
|
MITSUBISHI SHOGUN (00-16) (3%) |
FORD RANGER (02-06) PICK-UP WORK (-3%) |
|
TOYOTA HILUX (10-16) D-4D WORK (0%) |
FORD RANGER (05-06) CHASSIS (-3%) |
|
FORD RANGER (11-16) CHASSIS WORK (-9%) |
FORD RANGER (06-09) CHASSIS (-3%) |
|
FORD RANGER (11-16) PICK-UP WORK (-9%) |
FORD RANGER (06-09) PICK-UP WORK (-3%) |
|
NISSAN NAVARA (13-16) PICK UP (-9%) |
FORD RANGER (06-09) TIP (-3%) |
|
TOYOTA HILUX (07-10) D-4D WORK (0%) |
HGV MARKET OVERVIEW
Auction attendances fell again last month and with the summer holiday period in full swing increased activity is not expected until mid-September when traditionally the market tends to pick up. However, whilst auctions may be quiet at present there was a just a slight increase in on-the day sales but conversions of provisional sales have fallen by around 15%.
The average number of auction entries increased last month and stocks held by auctions are beginning to rise again. That said, awaiting the upturn in trade, one auction has held some stock over until after the holiday period hoping that better values can be achieved with increased attendances.
It may be the fall in activity during the holiday period has had an effect on Euro 6 values as they have remained fairly settled recently whilst values of Euro 5 rigids continue to decline at pace.
Plenty of vehicles and trailers continue to appear at recurring sales and there is still an awful lot of old stock around which is unlikely to sell any time soon as there is currently little appetite for it.
The number of Euro 6 vehicles appearing at auctions continue to increase, especially tractor units although there is a good smattering of rigids around looking for new homes, mainly 7.5 tonne. One auction advised that some Euro 6 vendors are still expecting high values and that some reserve values are therefore unrealistic, which is why many don’t sell at their auction debut. By the time reality kicks in and reserves are reduced the opportunity to realise the best value for the vehicle has already evaporated.
Dealers report that business could best be described as flat, with only isolated pockets of any meaningful activity. The lack of any real export trade and the summer holidays are not helping the situation. The change in Government policy towards Brexit is causing some anxiety amongst those who are exporting. Leaving on October 31st at any cost seems to be a significant possibility and without any real contingency plans some dealers are obviously a little unsettled.
A franchised dealer complained in conversation that due to current difficulties in funding part exchanges even sales of some new vehicles are becoming increasingly difficult.
Manufacturers report continued healthy sales, particularly of rigid vehicles. One bemoaned the recent sharp fall in Euro 6 tractor unit values citing that quantity is currently exceeding demand and went on to comment that he suspects that most manufacturers are in the same boat. Some are finding that the reluctance of buyers to purchase Euro 5 stock, some vehicles are being traded, but the resistance to some Euro 5 types is even making disposal to the trade increasingly difficult.
Records from our auction visits indicate that the average number of auction entries increased by 13%, and the number of on-the-day truck increased by just over 2% in relation to total entries whilst trailer sales increased by around 13% during the same period. This is based on seven auction visits and a total of 1268 viewed lots and as we always remind you these are ‘hammer sales’ on-the-day and converted provisional sales are not included. One auction reports that the current conversion rates of provisional sales has fallen to around 50%, which may be a result of this quieter period.
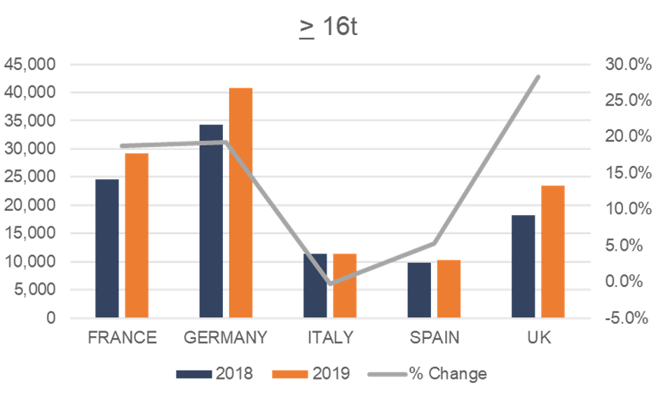
The graph below shows new registrations of vehicles over 16 tonnes for the five largest commercial vehicle markets in Europe for the first six months of 2019 compared to last year. It will be noted that there has been a considerable increase of new registrations in the UK which will no doubt affect the used market in three to five years’ time.
 This month’s research indicates that:
- 5t to 12t – Values of all types of Euro 5 vehicles continue to decline. Both pre-Euro 5 and Euro 6 values remain steady across most derivatives.
- 13t to 18t – Pre Euro 5 values have fallen once again but to a lesser extent to that of Euro 5 values where values continue to tumble. Euro 6 values have remained stable.
- Multi-wheel rigids – No change in Euro 6 values but pre-Euro 6 values have fallen a little.
- Tractor units – Values of most have steadied with the exception of a couple of Euro 6 models which have seen further drops in value.
- Trailers – Values for most types have fallen a little once again with the exception of platforms where values are unaffected.
7.5t to 12t Vehicles
Dropsides are finding new homes fairly readily and good quality curtains and boxes likewise, especially late registered low mileage ones. Fridges, remain plentiful particularly on DAF, Isuzu and Mitsubishi chassis but the bids being offered reflect their poor quality and in most instances sales don’t materialise leaving many to languish at auction sites often for considerable periods of time.
Older vehicles, particularly red boxes, continue to trade at values which are commensurate for age, mileage and condition but there are still plenty of older examples filling up yards.
With the exception of some utility type vehicles such as workshop boxes, mess rooms, libraries and the like, specialist vehicles often attract additional interest. That said, whilst specialist vehicles are often popular lots they do not always achieve their true value when one considers what they cost when new. Take refuse vehicles for example; high capital cost, limited aftermarket and low resale values.
Several Mitsubishi Fuso Canter 7C18 double deck car transporters on 62 and 63 plates appeared at a sale but unusually they failed to generate any real interest and none sold under the hammer.
13t to 18t Vehicles
Euro 5 and older boxes, curtains, platforms and fridges are readily available on a wide variety of chassis but because buyers have a preference for newer vehicles, with the exception of some Mercedes-Benz, Scania and Volvo models which have attracted some interest, sales of such are becoming increasingly difficult and values generally remain on a downward trend. That said even fresher examples are not selling as readily as they did a few months ago.
As we have commented before this sector is the bread and butter inter-urban distribution vehicle and it is likely to be the most affected type of vehicle by ultra-low emission zones. Many operators are now actively looking to purchase new or used Euro 6 vehicles which is why we are seeing so many older vehicles appear at auction.
Tippers remain reasonably popular and are relatively few and far between at present so they attract good attention as they appear.
Multi-wheelers
With the exception of Euro 6 vehicles values have again fallen across the board, including tippers which have seen interest dwindle a little recently. The expected lifespan of a multi-wheel rigid vehicle is greater than two axle vehicles therefore many of the vehicles in auction have often had more than one previous owner and it is those vehicles which are direct entries from their original operators that tend to attract just a little more interest, especially if there is a service history available and irrespective of vehicle type.
Several plant carriers have appeared in recent sales and these all proved popular lots, however good interest doesn’t always translate to a sale and that was the case here.
A sprinkling of fresh fuel tankers proved less popular and they will probably be kicking around for a while, adding to some similar vehicles which have been around for some time.
Refuse trucks continue to struggle to find new homes and some of the bids they attract account for them being cut up and scrapped.
A good selection of 8x4 hook loaders from a waste management company, primarily on Mercedes-Benz Axor, Scania P and Volvo FM chassis and ranging in age from 2004 to 2009, did well as they appeared for sale. Despite additional buyers fees bidding was brisk and most sold on the day.
Not faring so well was a 2016 66 plate Mercedes-Benz Arocs 3240 8x4 bulk blower with a four compartment body, on-board weighing, 2.3m Streamspace cab with air-con and 266,000 kilometres. It failed to produce and real interest and it quickly passed through unsold.
Another unsold vehicle was a 16 plate day cab 8x4 Iveco Trakker AT340T41 Crossland stainless steel tanker with only 95,000 kilometres and a long MOT which generated an offer of £80,000. At a subsequent auction it managed £76,000 and remained unsold.
Tractor Units
With the exception of a few Euro 6 6x2 models values have remained relatively steady, However, sales of tractor units seems to have slowed a little and it may be that as activity increases at the end of the summer sales will start to increase but what will happen value wise remains to be seen.
The recent falls in Euro 6 values has abated for now but if stocks continue to build values will doubtless be under renewed pressure. Will there be a strong Christmas demand for tractor units which will keep stock moving and values steady? Only time will tell.
Auctions have recently seen an increase in 6x2 rear lifts which are usually popular lots, especially so a finance repossessed 67 plate DAF FTR XF510 Superspace with twin pipe hydraulics and only 78,000 kilometres which sold easily after some competitive bidding.
Other popular lots are anything of a specialist nature. One such example was a 06 plate DAF FTG XF95.430 Superspace with hub reduction and a Palfinger PK42502 crane, two months remaining MOT and an unwarranted 460,000 kilometres. Interest was high and it sold for £20,500
Trailers
Trailer sales have continued to struggle recently and whilst sales are occurring values continue to decline with the exception of flat trailers that have seen increased interest and subsequently their values have held up.
The number of trailers available has reduced substantially recently, and the choice available is not as widespread as a few months ago. Most stock remains over ten years of age, many of which are no longer suitable for further use. However, anything below ten years old and in a reasonable condition is met with good interest and it is these trailers which are selling much easier.
Many boxes, fridges, tippers and skeletals have not been registering bids sufficient to conclude sales but curtains have been selling more easily but at reduced values.
However, it remains specialist trailers that continue to muster greatest interest, and a selection of low-loaders, one with four axles which did just that when they appeared at auction and most sold.
Although failing to sell a 2016 OMEPS 11.15m tri-axle 40m3 powder tank stirred up good interest. Age and condition together with its specialist nature helping it along to a reasonable highest bid.
A more successful lot was a 2013 10,7m tri-axle 30,000 litre Crossland stainless steel vacuum tanker which sold for £41,000

