
New Car Sales
The 2018 year-end new car sales figures showed an overall decrease of 173,470 or 6.8% compared to 2017, with 2,367,147 cars registered versus 2,540,617 a year previous, according to the figures released by the SMMT. Undoubtedly, it was a difficult year for manufacturers and dealers alike due in large part to regulatory changes and anti-diesel policies plus related media coverage. Put into context though, registrations were still ahead of where they were 5-years ago.
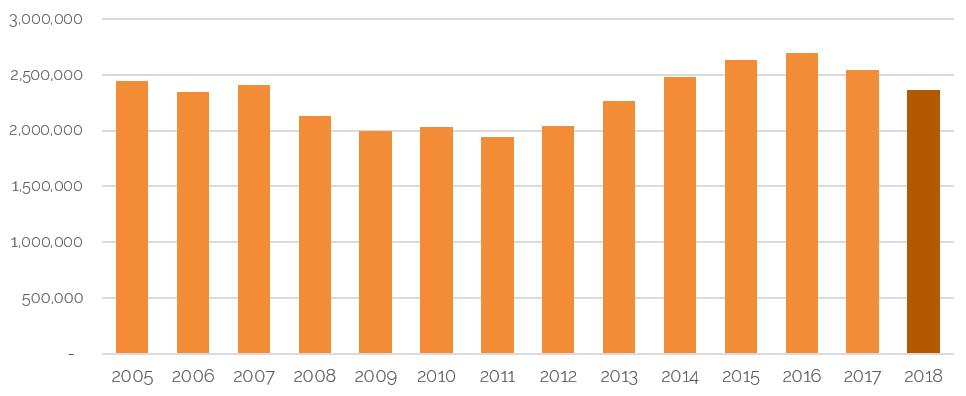
Source: SMMT
December itself did not result in an abundance of tactical registration activity and the month ended down 5.5% compared to the same month in 2017, with 144,089 cars registered compared to 152,473.
Diesel registrations continued to feel the brunt of the reductions, down 26.3% for the month and 29.6% for the year. Petrol-engine car registrations were up 7.2% for the month and 8.7% for the year. Alternatively fuelled cars continued to increase in popularity, up 6.1% in December but an impressive 20.9% for the whole year.
The chart below shows the share of the market of each fuel-type for each month, and clearly illustrates the changing dynamics from January 2017. At that time, the share of the market of petrol and diesel fuelled cars was similar, they have now diverged dramatically and in December petrol cars accounted for 64.4%, diesel cars 29.5% and alternatively-fuelled cars 6.2%.
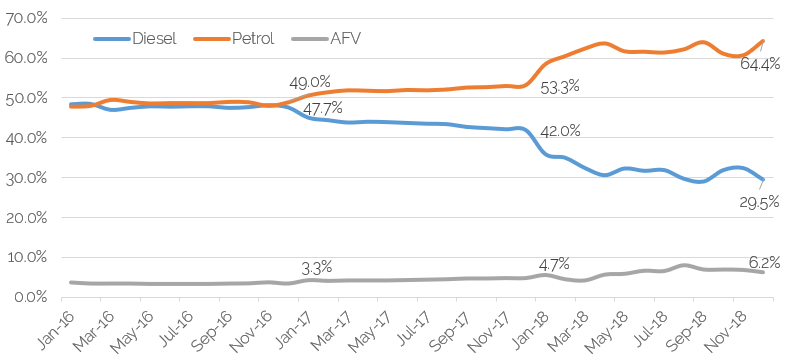 Source: SMMT
In amongst these figures, daily rental registrations in 2018 accounted for a lower number than in 2017, a fact that leads to lower numbers of newer used cars in the wholesale market. Almost 29,000 less cars were registered year-on-year, a reduction of over 12%. Reductions were not across the board however. As a low-profit generating area of their business and a potential adverse impact on residual values, it is always interesting to see manufacturer’s strategy in this area of the market, as they can choose whether to participate to any great degree. Brands that chose to increase volumes by the largest percentage year-on-year were Land Rover, Mini, BMW, Peugeot, Kia and Renault, whilst those reducing their exposure were Nissan, Ford, Skoda, Audi and Mercedes-Benz. It will be interesting to continue to view what impact this has on late-plate, used car values through 2019, also to see what strategy the different manufacturers employ this year with regards to registrations.
Used Car Retail Activity
The used car retail market in January was particularly interesting; in many cases, retail footfall struggled to materialise during the month. There were some pockets of strength, however, particularly amongst car supermarkets that invested heavily in advertising. Franchised dealers forecourts were much quieter and with some improved new car offers on the table from manufacturers, this may have had an impact on used car buying.
Any strength does appear to have been price-sensitive. Above a retail price point of circa £12,000, there was a lack of retail demand; below this point, cars still sold in higher numbers. Could this be a pointer to Brexit-led economic uncertainty, with a reluctance to make “big-ticket” purchases?
Used Car Remarketing Activity
January is a month where it generally takes a while for trading conditions to gain momentum, and this year was no exception. Many dealers and car supermarkets went into the festive period well stocked, due to acquiring volume in November and December, at arguably the cheapest points of the year; operators like to get themselves into a position to hit the ground running going into the New Year. Lower retail sales in the build up to the festive period maintained these higher stock levels, meaning there was less appetite for the trade to buy in volume during the first days of the year.
The difference this year to previous was that, overall, momentum in the market struggled to materialise at all, as the market in January remained steady but never really improved, due in large part by the aforementioned relatively slow retail market.
By the middle of the month fresh stock arrived but buyers appeared to be extremely vigilant when bidding, making sure the car was in the right condition, with reasonable mileage and importantly that it could be retailed at an attractive price for the consumer. Due to anything over that £12,000 price point for retail proving difficult, cars in the wholesale market under £10,000 proved popular and the £4-7,000 range was the most desirable.
The cap hpi auction survey did point towards January being a better month than December for respondents, but this was completely expected. Anecdotally, the month was not as healthy as January has been in previous years.
Auction stock levels increased and demand was also stronger, but December is always a low point for the latter. Whilst the auction halls were busy, there were many keeping more of a watching brief rather than actively buying in volume. Conversion rates were higher than in December, as expected, but not setting any records.
How do your current stock levels compare to the previous month?
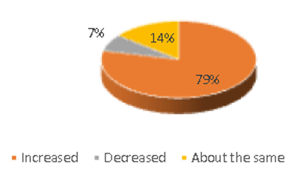
How does trade demand compare to the previous month?
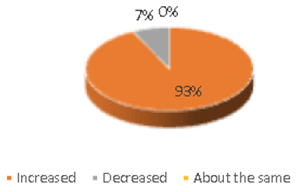
How do conversion rates compare to the previous month?
Whilst there was a consistent story being told in these results, there was certainly anything but in the actual market, with good days and bad days with regards to demand. Poorer condition cars certainly struggled in most instances, due to plenty of better quality stock. Supply outweighed demand, so the less desirable cars required some adjustment in pricing to help move them on.
Used Car - Trade Values
As predicted in last month’s overview, values did not increase in January. Over the last five years’ the movement in black book live for the whole of January was an average of -0.4%. This year the movement was -0.7%, and slightly lower than any of the previous years since our daily product was introduced.
Average downward movements were visible for each sector, with MPVs and SUVs the worst affected. Pricewise, MPVs have performed particularly well over the last few months, due to lower volumes in the market than in previous years as new car demand has switched more to SUVs, and used car demand has stayed strong. It would appear, however, that these type of cars are now coming under more pressure. Some models that were under particular pressure were the Citroen C4 Grand Picasso, Fiat 500L and the Mercedes-Benz B-Class, all moving down in value by more than the rest of the sector.
SUV values edged down by 1% on average, due to supply slightly outweighing demand. Within the trade sold data analysed by cap hpi, the annual volume of data for SUVs has almost trebled in volume in 6-years. In 2013, SUVs accounted for 10% of the sold volume; in 2018 it was over 20%. Overall trade volumes received have increased but more so for SUV, with close to 400,000 records scrutinised last year for this sector alone; retail evidence is also heavily analysed. So, whilst these cars sell well, there is no shortage of choice for buyers. Examples of SUVs that struggled to achieve previous cap values in January, so moved down by more than the norm, were Audi Q3, BMW X3 and Range Rover Evoque.
Other mainstream sectors moved down by between 0.4 and 0.8%, but as always there was some strength and weakness, depending on the model, within those figures. The Ford Focus stands out as one mainstream model where values went up following strong price performance.
The good news story for electric cars continued into the New Year. Whilst some of the more expensive models in this sector continued to struggle, values for some of the more mainstream vehicles like the older iteration of the Nissan Leaf, the BMW i3 and the Renault Zoe offer great value for money and are packed full of technology for someone looking to be an EV adopter. Demand outweighs supply for these vehicles.
There was little discernible difference in the value movement of petrol and diesel cars, with demand remaining similar for both. Feedback from the trade backs this up.
What Next?
There is undoubtedly some uncertainty around the economy at the current time, with still no real clue as to how the run up to the Brexit deadline in March will pan out or what the picture will be like afterwards. With so much uncertainty over the structure of any deal (or otherwise) it is impossible to predict what might happen to the used vehicle market. On the one hand, an economic downturn could lead to a difficult used car market, but if new car supply were to be affected by exchange rates, leading to price increases, this could push more consumers into the used car arena. Only time will tell.
The average monthly movement during February, an accumulation of black book live movements during the month, since 2013 has been an upward one of 0.3%. February is traditionally a month where prices can go up, as demand increases and the year settles into a pattern. It remains to be seen whether this will happen in 2019. Prices were strong for the majority of last year (up almost 2% over the course of 2018) and there may not be an appetite for buyers to pay more. There has also been a slightly weaker start to the year than in recent times so familiar patterns may not follow.
Whatever happens over the upcoming uncertain weeks, it is vital for the motor trade to keep an eye on real-time used values and the detail held within our Live valuations. Supply levels, in conjunction with the economic state of the nation, will undoubtedly lead to nuances within the market that will be reflected in these value movements.
black book February 2019 - Average Value Movements
|
|
1 YR/10K |
3 YR/60K |
5 YR/80K |
|
City Car |
(0.5%) |
(0.5%) |
(0.6%) |
|
Supermini |
(0.9%) |
(0.4%) |
0.2% |
|
Lower Medium |
(0.9%) |
(0.5%) |
(0.5%) |
|
Upper Medium |
(0.6%) |
(0.6%) |
(0.6%) |
|
Executive |
(1.0%) |
(0.8%) |
(0.3%) |
|
Large Executive |
(0.9%) |
(1.1%) |
(0.8%) |
|
MPV |
(1.4%) |
(1.2%) |
(1.1%) |
|
SUV |
(1.0%) |
(1.0%) |
(1.2%) |
|
Electric |
0.9% |
1.2% |
1.5% |
|
Convertible |
(1.4%) |
(1.5%) |
(1.7%) |
|
Coupe Cabriolet |
(2.1%) |
(1.6%) |
(1.2%) |
|
Sports |
(0.8%) |
(0.6%) |
(0.6%) |
|
Luxury Executive |
(0.8%) |
(0.9%) |
(0.4%) |
|
Supercar |
(1.0%) |
(0.8%) |
(0.3%) |
|
Overall Avg Book Movement |
(0.9%) |
(0.7%) |
(0.6%) |
( ) Denotes negative percentages
Notable Movers 1yr 20k
Generation Name
MIN £
MAX £
Avg £
AUDI A3 (12- )
-500
-350
-433
BMW 3 SERIES (12- ) DIESEL
-250
-100
-183
BMW i3 (13- )
400
400
400
FORD FOCUS (11-18) DIESEL
150
200
155
MAZDA 6 (13-18)
100
150
135
MERC C CLASS (14-18) DIESEL
-600
-350
-482
MERC S CLASS (13- ) DIESEL
-900
-700
-800
NISSAN QASHQAI (13-18)
-450
-100
-261
TOYOTA VERSO ESTATE (09-18)
100
150
134
VOLVO V40 (12- ) DIESEL
-650
-100
-230
Notable Movers 3yr 60k
Generation Name
MIN £
MAX £
Avg £
AUDI A3 (12- ) DIESEL
-350
-175
-226
BMW 1 SERIES (11-17) DIESEL
-300
-150
-203
BMW MINI COOPER (13-18)
-225
-125
-177
FORD B-MAX (12-18)
-200
-100
-177
FORD FOCUS (11-18)
100
175
140
LAND ROVER RANGE ROVER EVOQUE (11- ) DIESEL
-750
-450
-552
RENAULT CAPTUR (13- )
-175
-100
-132
TOYOTA AURIS (12- ) HYBRID
100
150
121
VOLKSWAGEN GOLF (13- ) DIESEL
-150
-75
-101
VOLVO XC60 (08-17) DIESEL
-350
-250
-296

