
New Car Sales
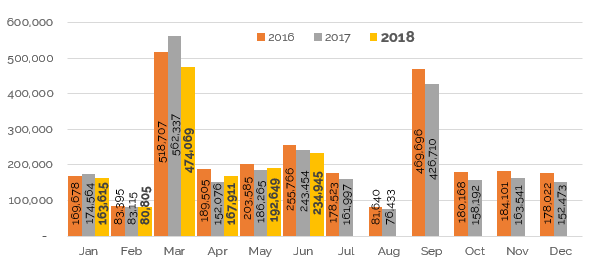
According to figures produced by the SMMT, 234,945 cars were registered in June, a reduction of 3.5% compared to the same month in 2017, when the volume was 243,454. As we passed the midway point in the year, 1,313,944 cars had been registered compared to 1,401,811 at the same point in 2017, a reduction of 6.3%. The new car market continues to move towards more natural, demand-led volumes.
Source: SMMT
Source: SMMT
Petrol continued to be by far the dominant fuel-type with 61.8% of registrations year-to date, diesel recording just 32.6%. A year ago, the split was 53.1% petrol and 42.5% diesel. At the same point 2-years ago, petrol accounted for 49.2% and diesel 47.5%. The change is stark.
The graph below shows the share by propulsion method for each month, an almost constant widening of the gap between the two dominant fuel types since the start of last year, led undoubtedly by government policy.
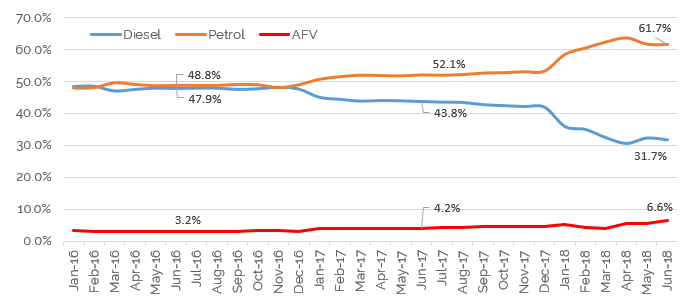
Source: SMMT
Alternative Fuelled Vehicles (AFVs) continue their notable increases in the new car market as acceptance of the technology, driveability and mileage ranges on offer widen. Whilst only accounting for 6.6% in the month and 5.5% year-to-date, the increase was 45.0% compared to June 2017.
Used Car Retail Activity
With the World Cup now a distant but relatively happy memory, and the unbelievable weather still with us, what kind of impact did both have on retail activity in July?
As predicted, the football had no lasting impact on demand. Whilst consumers did stay at home, hoping for football to come home, when England were playing, they were back out the day, or week, after. Overall, footfall could be described as “steady”, which is generally the best that can be expected in the summer months, particularly with the weather being so good and other leisure pursuits being at the forefront of people’s minds. This is testament to the strong used car market experienced all year thus far.
Towards the end of July, used car supermarkets, franchised dealers and independent retailers were all similar in their opinions that they had experienced a reasonably good time of it, many slightly better than in June, with the best week being just after the middle of the month. Once the holiday period started, from around the 20th, demand did slowly start to tail off, but not to any great degree.
Used Car Remarketing Activity
As to be expected with a stable retail market, remarketing activity remained likewise.
Certainly, there was a theme that strength in the market was not across the board, however. Ready-to-retail, “cap clean” cars generally had plenty of potential buyers, whereas cars in poorer condition struggled. At auction, it was those cars requiring work to be done to get them on the forecourt that took more than one sale to find a home, if at all, and if they did sell it was at some cost to the vendor compared to a car in “clean” condition. Higher mileage cars also struggled to sell.
There was a lack of a consistent message from the auction houses regarding buyer demand. There was almost a 50:50 split in the month’s cap hpi auction survey between those stating that demand was the same as in June and those saying it had reduced – very few cited an increase. Almost half though did state that conversion rates had improved.
With regards to demand for used diesel cars – a hot topic with new car sales diminishing for this fuel-type – respondents to the survey were almost unanimous that demand remained unaffected.
Stock levels at auction appeared to increase in July, albeit slightly, with 38% of respondents to the auction survey saying as much and a further 46% saying they were about the same. However, only a very small number expect numbers to increase in August, with almost half expecting volumes to reduce.
The general theme from speaking to the auction houses was one of inconsistency between sales on particular days and at different venues. Whilst overall things were steady and stable, there were good sales and bad sales through the month.
Used Cars – Trade Values
The cycle of average value movements being more positive than in the same month in the previous year has now been broken – this rare phenomenon lasted for 12 months.
The movement in black book live during July, which leads to August’s monthly product, at the 3-year point was -0.7%, compared to last year’s -0.5%. This difference is negligible, however, and needs to be put into context around movements at this point of the year previously. July 2017 in black book live was the initial month of the recent strength in the used car market, with that -0.5% movement being unusually strong. The average movement over the previous 4-years was a downward one of 1.4%. Indeed, in 2016 the movement was -1.6% so this year’s -0.7% is still a more than reasonable month for used car values.
Looking at specific areas of the market, city cars and superminis, dropped in value by slightly more than the average movement. Some models that have been particularly strong in the past few months have now peaked – for the second month in a row the Chevrolet Spark has dropped by more than the norm, now amounting to a 6% drop over the space of 2 months. The Suzuki Splash (-4%) and Fiat 500 (-2% on average) also struggled to find a match between demand and supply and moved down during July. The strength that we have seen over the past year in particular in this smaller end of the market does appear to have drawn to a close. This is unsurprising, as many cars have gone up in value over this period – something that is unsustainable in the used car market in the long term.
SUVs, despite being almost 20% of the used car volume (and over 30% of the new car market now), outperformed the market, with regards to prices achieved. Values dropped, but only by 0.4% at 3 years old; this was a strong performance overall. The main strength was in the medium SUV size of car, with some models such as the Nissan Juke (petrol), Renault Kadjar (petrol and diesel) and the Skoda Yeti (petrol) actually going up in value. Larger SUVs struggled in comparison, however, with models such as the Ford Edge, Mercedes-Benz GLE (diesel) and BMW X5 (diesel) all dropping by around 2%. Not insignificant amounts (in excess of £500), even at the 3- year, 60,000 mile point.
Of the remaining volume sectors, lower and upper medium cars generally performed in line with the overall market (down 0.7% and 0.9% respectively), although as always there were weak and strong performers within those figures. MPVs remained fairly level on average during July, but again the picture was mixed. There seemed almost an even split between strong and weak performers – the strong ones undoubtedly helped by lower returning volumes and the weaker ones struggling due to a drop in demand as consumers now tend to favour SUVs. Some strong performers were the Peugeot 3008 (petrol), Citroen Berlingo Multispace (petrol) and the Volkswagen Caravelle (diesel). As the holiday season fast-approached this helped increase demand as people realise the functionality of an MPV suits their needs. Amongst the MPVs that reduced in value were the Ford B-Max (diesel), the Mercedes-Benz B-Class (diesel) and the Volkswagen Caddy Life (petrol).
What Next?
The reasons for the strength in the used car market over the last few months can be isolated to a few factors. With some mainstream manufacturers reducing their volumes, relying more on natural demand and profitability than “pushing” cars into the new car market via pre-registration, daily rental or strong fleet discounts or consumer offers, demand has switched for many buyers into the used car market. There has also been lower number of part-exchanges appearing, in both the retail and fleet, particularly rental, areas. Rental companies continue to hold onto cars for longer than normal, as rental demand is strong, and also purchase used cars to satisfy their volume requirements.
This is likely to continue for now, although undoubtedly the largest short-to-medium term impact on the whole car market, new and used, is the issue of WLTP (Worldwide Harmonised Light Vehicle Test Procedure). Currently there is no clear picture on how this will impact the market, and there will be differences by manufacturer. However, with the 1st September deadline fast approaching, there are likely to be some strong new car offers and pre-registration activity, to help sell those cars that do not meet new guidelines and cannot be registered after that date. Rental companies demand may help manufacturers register of some of these cars, but at a cost. Other likely impacts due to WLTP are the withdrawal of some engines and trims, increased tax burdens for certain cars and longer lead times for new cars as manufacturers continue to get themselves organised.
All of this adds up to an unclear picture for the used car market; some of the above factors could aid used car values, others could be detrimental.
Add in to the mix the holiday season, the fact that prices of petrol cars are generally high, due to increases in demand over the last year or so, and there are many diesel cars still to return to the used car market (demand may reduce for these), the picture is less than clear.
It will certainly be an interesting few months. The cap hpi team, in particular the black book editors and analysts, will be tracking new and used car activity, keeping a close-eye on late-plate, vehicles and tracking the used market daily. Any value movements will be reported in black book live first and as they happen.
black book August 18 - Average Value Movements
|
|
1 YR/10K |
3 YR/60K |
5 YR/80K |
|
City Car |
(0.9%) |
(1.1%) |
(1.6%) |
|
Supermini |
(0.8%) |
(1.4%) |
(1.8%) |
|
Lower Medium |
(0.7%) |
(0.6%) |
(1.1%) |
|
Upper Medium |
(0.7%) |
(0.9%) |
(1.1%) |
|
Executive |
(0.7%) |
(0.8%) |
(0.5%) |
|
Large Executive |
(0.8%) |
(1.3%) |
(1.8%) |
|
MPV |
(0.2%) |
(0.0%) |
(0.3%) |
|
SUV |
(0.6%) |
(0.4%) |
(0.4%) |
|
Electric |
(0.6%) |
0.1% |
(1.1%) |
|
Convertible |
(0.2%) |
(0.6%) |
(0.8%) |
|
Coupe Cabriolet |
(0.8%) |
(0.8%) |
(0.6%) |
|
Sports |
(0.8%) |
(0.9%) |
(1.0%) |
|
Luxury Executive |
(1.9%) |
(1.4%) |
(1.1%) |
|
Supercar |
(1.0%) |
(0.9%) |
0.0% |
|
Average Movement |
(0.6%) |
(0.7%) |
(1.0%) |
( ) Denotes negative percentages
Notable Movers 3yr 60k
GENERATION NAME
MIN £
MAX £
AVG £
AUDI A1 (10- ) DIESEL
-325
-125
-237
BMW 5 SERIES (13-17) DIESEL
-200
-100
-146
BMW MINI ROADSTER (12-15)
125
250
175
BMW X3 (10-18) DIESEL
-650
-250
-395
CITROEN C4 PICASSO (13- ) DIESEL
-250
-200
-215
FORD FIESTA (08-17)
-225
-100
-159
FORD FOCUS (11- )
-400
-100
-159
HYUNDAI I30 (12-18) DIESEL
-150
-100
-127
HYUNDAI I40 (11- ) DIESEL
-275
-175
-226
KIA CEED (12- ) DIESEL
-350
-175
-237
MAZDA CX-5 (12-17)
100
150
112
MERC A CLASS (12-18)
275
750
360
PEUGEOT 3008 (09-17) DIESEL
-200
-100
-175
PEUGEOT PARTNER TEPEE (08- ) DIESEL
125
200
178
RENAULT MEGANE COUPE (09-16) DIESEL
125
125
125
SUZUKI JIMNY (05-18)
275
475
358
VAUXHALL CORSA (11-15) DIESEL
-225
-100
-158
VAUXHALL INSIGNIA (13-18) DIESEL
-175
-125
-143
VOLKSWAGEN TOUAREG (10- ) DIESEL
-500
-150
-225
VOLVO XC60 (08-17) DIESEL
250
350
303

