
This is the editorial commentary to accompany the cap hpi guide to future residual values for new cars.
The content is as follows:
- gold book forecast accuracy
- Forecast changes this month
- Market overview
- gold book methodology
- Reforecast calendar 2018-2019
1. gold book Forecast Accuracy
As gold book matures since its introduction in December 2013, we have the data to enable us to measure our results in terms of forecast accuracy. The accuracy target widely demanded by our customers is to be within 5% of actual values and we are pleased that, averaged across all models, gold book has been generally within this target for most of the period since launch.
The unexpected growth in strength of petrol car values through 2017 and into 2018, has resulted in our recent accuracy results showing more under-forecast than was previously the case, especially in the City Car and Supermini sectors. We expect this position to correct over time due the sector reforecasts made in 2017, and our expectation that petrol strength will start to diminish as petrol values peak and more used petrol volume comes the market. There are indications that this is now starting to happen.
The results of our longer-term forecasts from 3 and 4 years ago have so far shown more under-forecast than the results of our shorter-term forecasts from 1 and 2 years ago. This is largely because the impact of changes made in previous sector reforecasts take longer to flow through into our accuracy results.
In April 2018 we introduced an improved accuracy reporting mechanism, weighted by registration volume, and our historic accuracy trends now reflect this weighting. This month we are able to include a breakdown of accuracy by fuel type for the first time.
Also this month we have re-introduced tables showing the current months’ accuracy figures, following feedback that some customers use these tables for their own tracking purposes.
12 month results
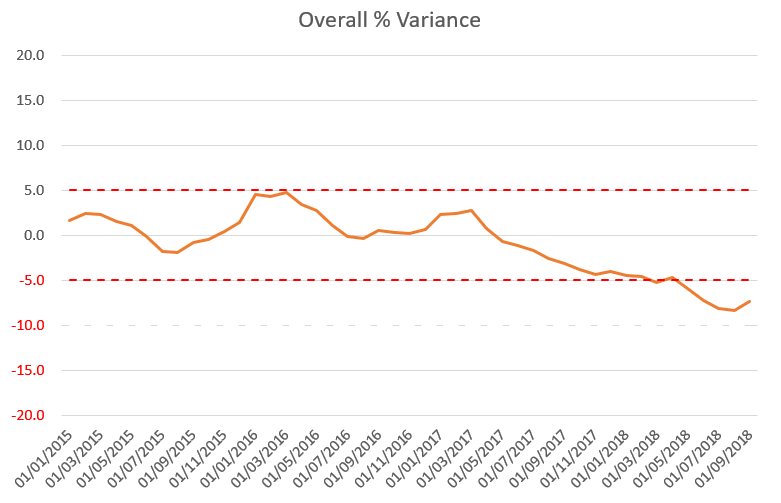
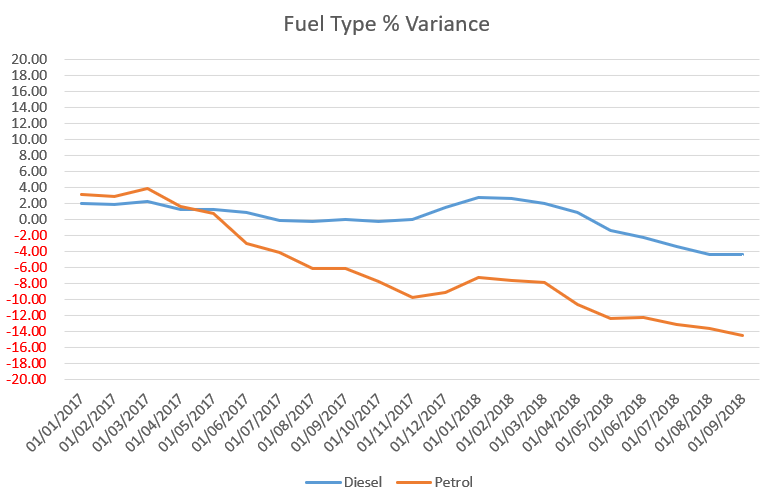
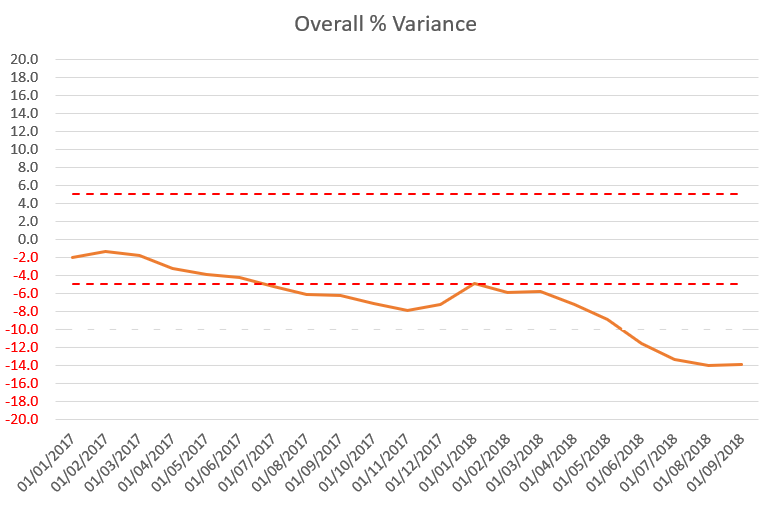
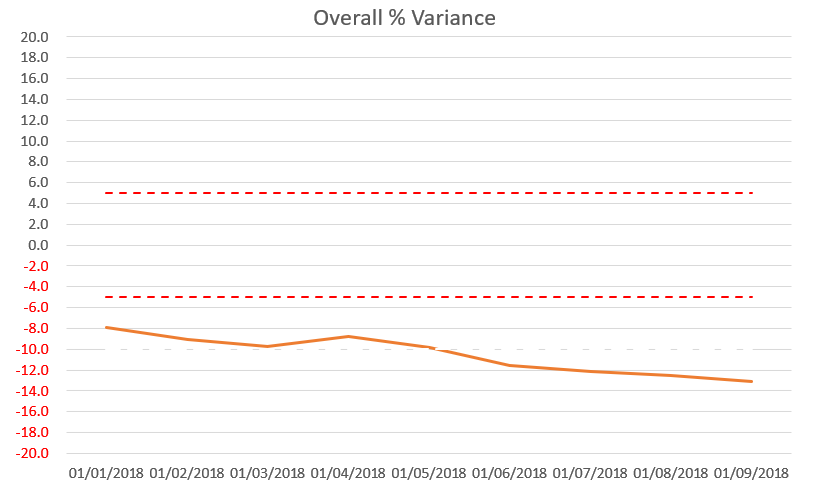
Since measurement started our 12 month forecasts have averaged -0.9% less than black book across all vehicle ids, and the most recent results show September 2017 12/20 gold book forecasts being -7.3% less than September 2018 12/20 black book.
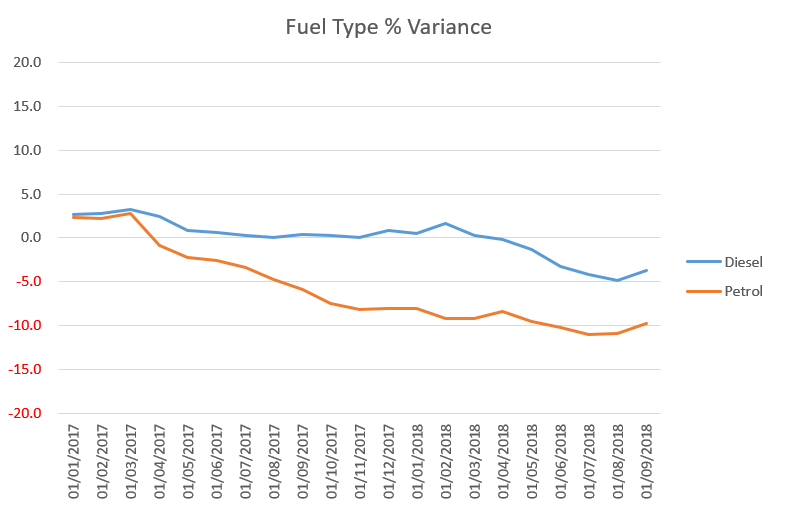
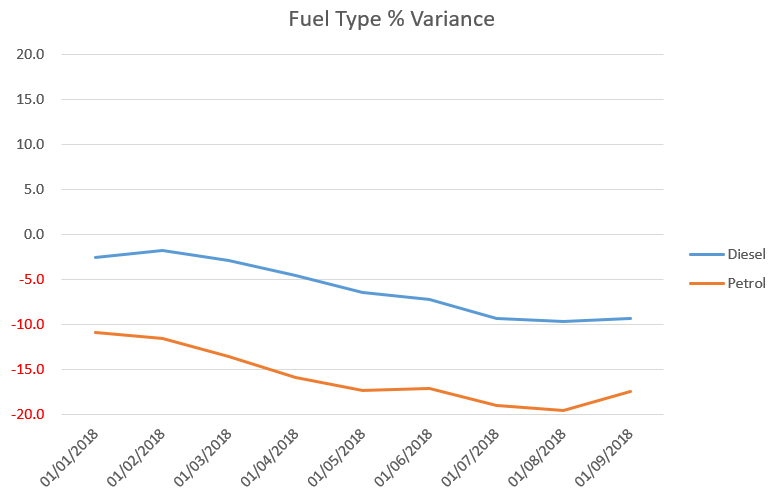
Split by fuel type, and focussing on post 2016 results, diesel accuracy remains within target while petrol accuracy has been adversely affected by the current market strength for petrol.
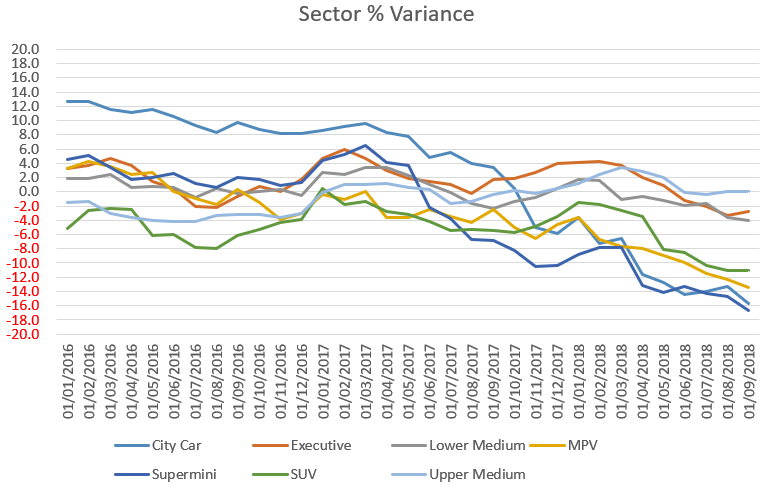
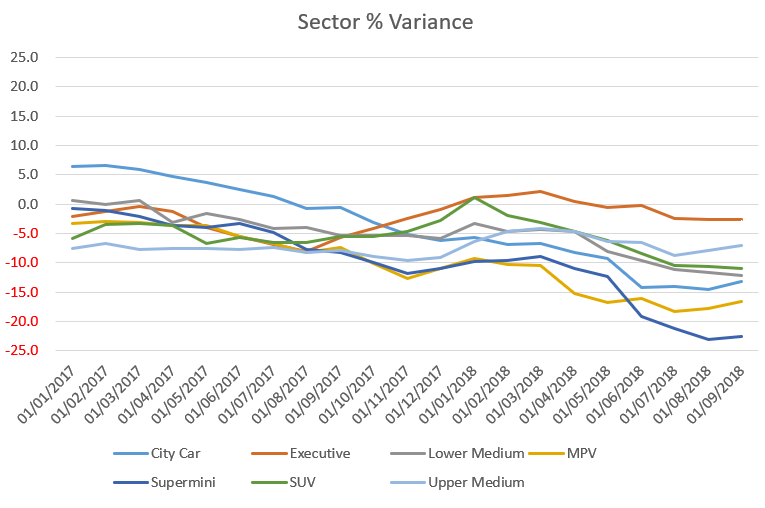
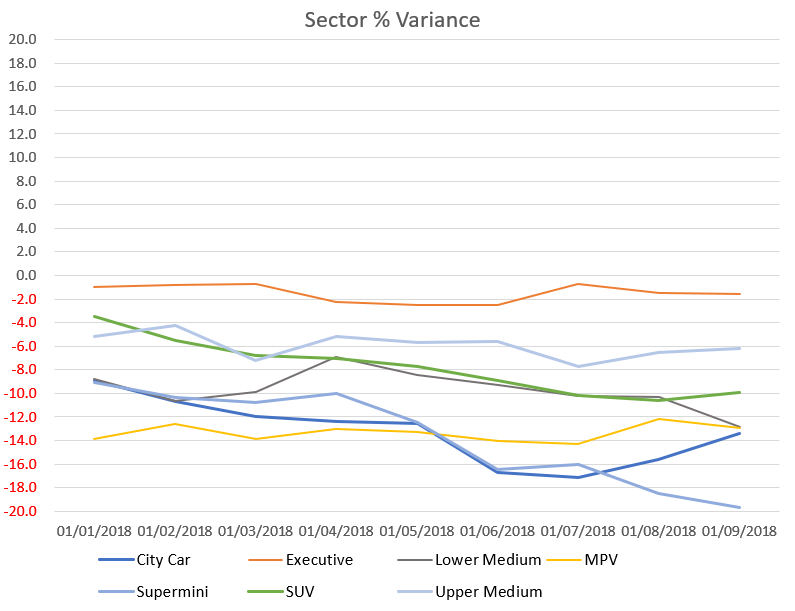
Split by the main vehicle sectors, most of these have been within target for the majority of the reporting period, except for City Car which was initially over-forecast as a result of unforeseen and prolonged excessive forced registrations, and more recently some sectors (especially City Car, SuperMini) and MPV have been under-forecast due to the unexpected strength of petrol values since 2017
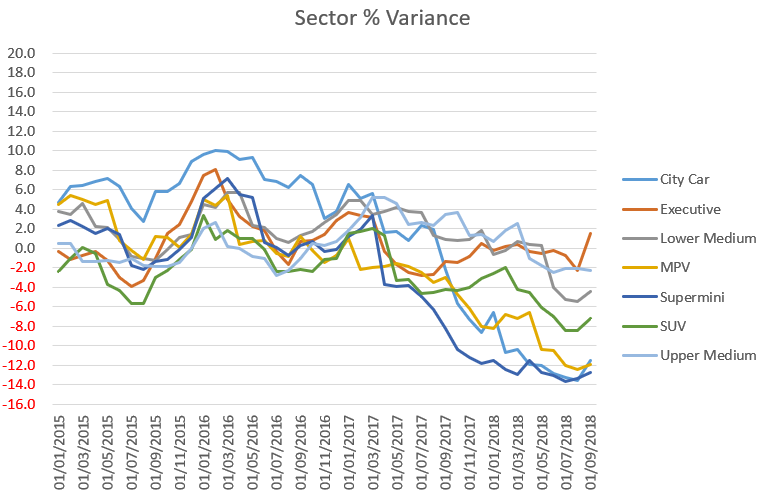
The most recent results for these main sectors are as follows:
|
Sector |
|||||||
|
BB Month |
City Car |
Executive |
Lower Medium |
MPV |
Supermini |
SUV |
Upper Medium |
|
01/09/2018 |
-11.5 |
1.5 |
-4.4 |
-11.9 |
-12.7 |
-7.2 |
-2.3 |
24 month results
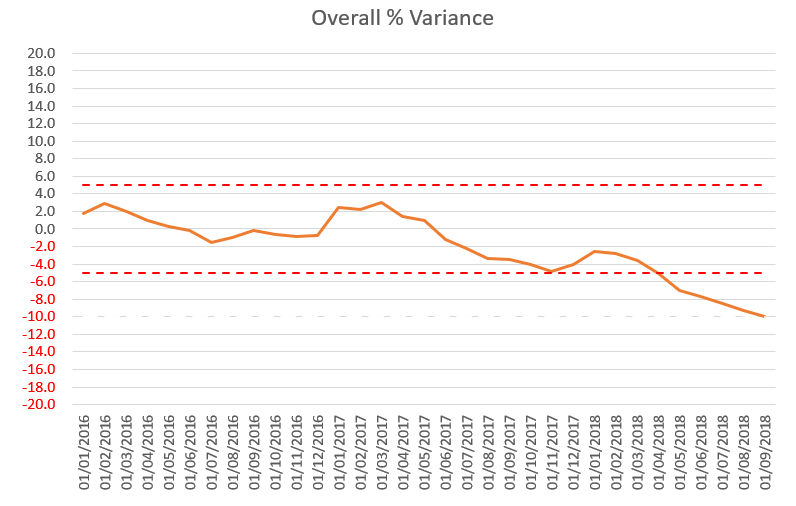
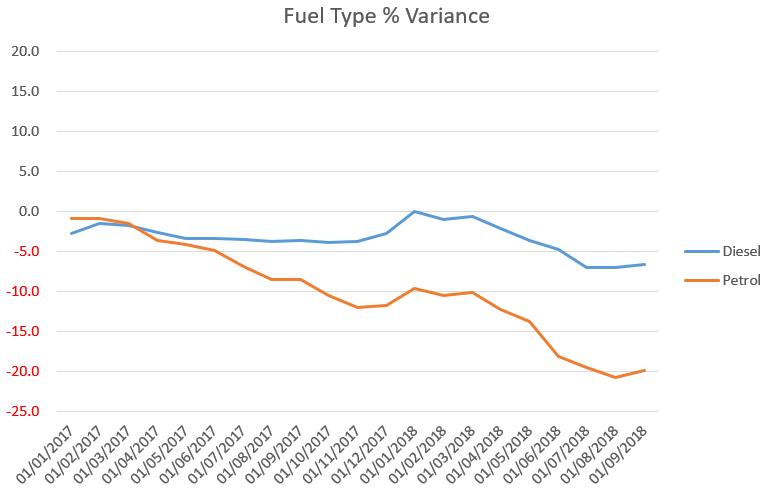
Since measurement started our 24 month forecasts have averaged -2.0% less than black book across all vehicle ids, and the most recent results show September 2016 24/40 gold book forecasts being -10.0% less than September 2018 24/40 black book.
Split by fuel type, and focussing on post 2016 results, diesel accuracy remains within target while petrol accuracy has been adversely affected by the current market strength for petrol.
Split by the main vehicle sectors, most of these have been within target for the majority of the reporting period, except for City Car which was initially over-forecast as a result of unforeseen and prolonged excessive forced registrations, and more recently some sectors (especially City Car and SuperMini) have been under-forecast due to the unexpected strength of petrol values since 2017
The most recent results for these main sectors are as follows:
|
% Variance |
Sector |
||||||
|
BB Month |
City Car |
Executive |
Lower Medium |
MPV |
Supermini |
SUV |
Upper Medium |
|
01/09/2018 |
-15.7 |
-2.7 |
-4.1 |
-13.5 |
-16.6 |
-11.0 |
0.0 |
36 month results
Since measurement started our 36 month forecasts have averaged -6.8% less than black book across all vehicle ids, and the most recent results show September 2015 36/60 gold book forecasts being -13.9% less than September 2018 36/60 black book.
Split by fuel type, diesel accuracy has been within target until very recently, while petrol accuracy has been adversely affected by the current market strength for petrol.
Split by the main vehicle sectors, most of these have been outside the under-forecast
target for the majority of the reporting period, most notably City Car, Supermini and MPV. As previously stated, this largely due to the unexpected strength of petrol values since 2017, which was not foreseen when setting forecasts 3 years ago.
The most recent results for these main sectors are as follows:
|
Sector |
|||||||
|
BB Month |
City Car |
Executive |
Lower Medium |
MPV |
Supermini |
SUV |
Upper Medium |
|
01/09/2018 |
-13.2 |
-2.6 |
-12.2 |
-16.7 |
-22.7 |
-10.9 |
-7.1 |
48 month results
Since measurement started our 48 month forecasts have averaged -10.5% less than black book across all vehicle ids, and the most recent results show September 2014 48/80 gold book forecasts being -13.1% less than September 2018 48/80 black book.
Split by fuel type, diesel accuracy has been more accurate than petrol accuracy, which has been adversely affected by the current market strength for petrol
Split by the main vehicle sectors, most of these have been outside the under-forecast target for the majority of the reporting period, notably City Car, Supermini and MPV. As previously stated, this largely due to the unexpected strength of petrol values since 2017, which was not foreseen when setting forecasts 4 years ago.
The most recent results for these main sectors are as follows:
|
% Variance |
Sector |
||||||
|
BB Month |
City Car |
Executive |
Lower Medium |
MPV |
Supermini |
SUV |
Upper Medium |
|
01/09/2018 |
-13.4 |
-1.6 |
-12.9 |
-12.9 |
-19.7 |
-9.9 |
-6.2 |
Overall results
We are pleased with these accuracy results since the launch of gold book, despite the recent fall-off in accuracy due to current market conditions, which we do not expect to last. We are taking advantage of our new methodology to implement a ‘virtuous feedback loop’, with each element of the forecast examined to determine how best to further improve the accuracy of our future value forecasts, while also reducing variation. This has shown itself to be effective over the relatively long period we have been measuring 12 and 24 month results, and we expect the same to be true of our future 36 and 48 month results.
We will continue to publish these results and share them with our customers.
2. Forecast changes this month:
New model ranges added this month:
Audi A6, Ferrari Portofino, Jeep Wrangler and Lexus ES
There are numerous additions to the following model ranges:
Alfa Romeo Giulia, Alfa Romeo Giulietta, Alfa Romeo Stelvio, Alpine A110, Audi A1, Audi A3, Audi A7, Audi A8, Audi TT, Audi Q3, Audi Q8, Citroen Berlingo, Citroen C1, Citroen C4 Cactus, Citroen C4 SpaceTourer, Citroen Grand C4 SpaceTourer, Ford Tourneo Courier, Lexus CT, Mini Clubman, Mini Countryman, Mini Hatchback, Mercedes-Benz C-Class, Mercedes-Benz CLS, Mercedes-Benz E-Class Estate All Terrain, Peugeot 208, Peugeot 308, Renault Koleos, Renault Megane, Skoda Karoq, Smart ForTwo, Volkswagen Caravelle and Volkswagen California.
Sectors reforecast this month
This month, we publish our new reforecasts for the City Car and Supermini sectors.
The overall impact of the changes at 36/60 is set out below:
|
SECTOR |
UNDERLYING FORECAST CHANGE |
SEASONAL ELEMENT |
OBSERVED CHANGE SEPTEMBER TO OCTOBER |
|
City Car Petrol City Car Diesel Supermini Petrol Supermini Diesel |
+4.2% +3.8% +4.3% +2.2% |
+0.2% -0.5% +0.5% +0.4% |
+4.4% +3.3% +4.8% +2.6% |
We have reviewed and revised our future market deflation assumptions for these sectors, based on our latest forecasts for new car registration volumes, and the latest UK economic forecasts. These determine the balance of used car supply and demand, which drives future market deflation/inflation.
In both the City Car and Supermini sectors we consider that over the next five years, overall registration volumes will continue to decline and there will continue to be a significant shift from diesel into petrol. Similarly, used demand will shift from diesel into petrol.
For used diesel cars, the change of supply and demand will balance out and so we are not changing our diesel deflation assumptions.
For used petrol cars, the balance will tip slightly in favour of less deflation than we had previously assumed, so in both sectors we are slightly improving our petrol assumptions, and the impact at 36/60k will be approximately +0.5% improvement (less deflation). It should be noted that although these sectors have displayed inflation of petrol values for the past year or more (particularly City Car), we consider this to be unsustainable and believe that a return to deflation is imminent. Historical cycles of inflation followed by deflation support this view, and we are already seeing evidence of inflation starting to fall away.
The impact of the revised deflation assumptions at 36/60 is set out below:
|
SECTOR |
UNDERLYING FORECAST CHANGE |
DEFLATION CHANGE COMPONENT |
OTHER CHANGES COMPONENT |
|
City Car Petrol City Car Diesel Supermini Petrol Supermini Diesel |
+4.2% +3.8% +4.3% +2.2% |
+0.5% - +0.5% - |
+3.7% +3.8% +3.8% +2.2% |
‘Other Changes Component’ includes the impact of additional elements such as latest black book values, editorial adjustments and model lifecycle.
Fuel efficiency adjustment
In these sector reforecasts, we have removed the model-specific fuel efficiency adjustments from the new forecasts. These were relatively small adjustments applied to only those models with very high or low fuel efficiency compared to the sector average.
This decision was taken because our fuel efficiency data is now becoming a mix of old NEDC figures, and new NEDC correlated figures, as a result of the pending implementation of WLTP.
We will consider re-introducing the fuel efficiency adjustments when our data is consistently based on NEDC correlated figures.
Other forecast changes this month (in addition to sector reforecasts)
Alfa Romeo Stelvio petrol and diesel: increased walk-ups for Speciale and Milano trims, to align with latest black book research, resulting in increased forecasts.
Audi A7 diesel: tagging correction on IDs 86281 and 86282 (previously incorrectly tagged as Quattro), resulting in decreased forecasts.
Ford Ecosport petrol and diesel: reforecast ahead of schedule following inter-product analysis of black and gold book values, resulting in increased forecasts.
Renault Koleos diesel: increased walk-up for Signature Nav trim, to align with latest black book research, resulting in increased forecasts for Signature Nav and Initiale Paris derivatives.
Seasonality changes
In line with our gold book methodology, all other model ranges which are outside of the sector reforecasts and outside of the other changes listed above, have had their values moved forward from month to month by seasonal factors which are differentiated by sector and fuel type and are based on analysis of historical black book movements.
Overall impact on forecasts
The overall average change between the new gold book forecast and the previous gold book forecast is approximately +0.4% at 36/60, which is slightly higher than the normal expectation of the seasonal change for full year forecasts between September and October. This is due to the impact of the sectors reviewed this month.
Details of all values revised by ±5% can be found via the following link: Monthly Reports
3. Market Overview
Brexit negotiations are ongoing and include the possibility of a no-deal exit, but the final outcome is still unknown. However, future trade agreements which negatively impact the UK economy (and that of other major EU states) are still considered unlikely.
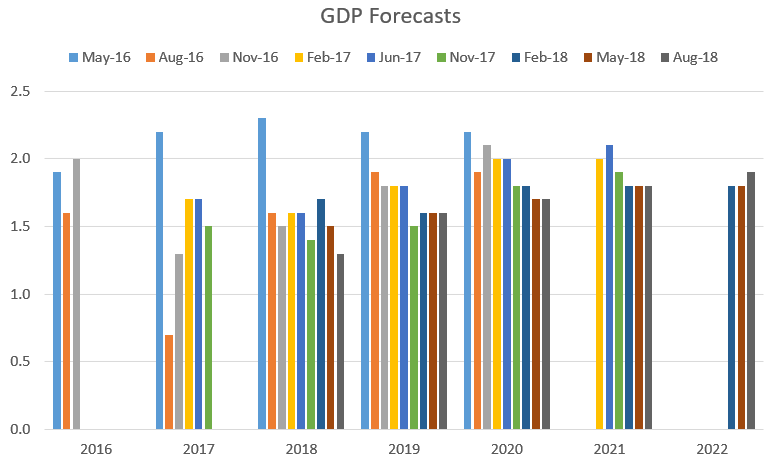
The outlook for the UK economy remains unchanged. The latest new independent economic forecasts published by HM Treasury in August still do not forecast a recession and therefore remain in line with our own view. Compared with the previous May Forecasts, the new ones show a slight reduction in GDP in 2018, no change in 2019 to 2021, and a small improvement in 2022.
Not all ages and sectors of vehicle are directly impacted by GDP, but those that are then in some cases reduced GDP will be offset by lower future registration volumes.
The latest forecasts for inflation and unemployment also show no signs for concern.
We are planning to conform to our original timetable of sector reforecasts and do not consider it necessary to embark on a concurrent reforecast of every sector at the same time.
In 2017, as we expected, the exchange rate level since the Brexit referendum made the UK less profitable for manufacturers and registration volumes fell by 5.7%, assisted by diversion of volume to other European countries, where pent up demand for new cars remains from the recession in 2008/2009. In 2018 overall registrations are down 4.2% (up to the end of August).
In 2017, diesel registration volumes fell by 17.1%, accelerating the trend seen in recent years. In April 2018 we saw the implementation of an additional 1% BIK surcharge for diesel company cars that do not meet the latest emission standards; and an increase in the 1st year VED rate for diesel cars not meeting the latest emissions standards. Both of these changes are likely to further discourage new diesel registrations, which are down 28.7% ytd in 2018 (up to the end of August).
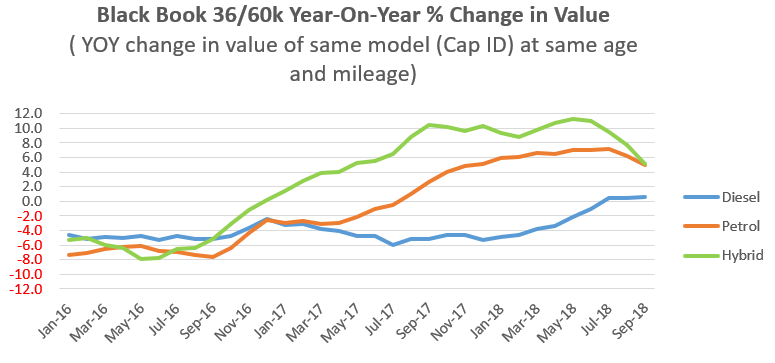
However used diesel values have held up well (in line with our historic future deflation assumptions), but petrol and hybrid values have been particularly strong (exceeding our historic future deflation assumptions) as buyers seek an alternative to diesel where available. We have always considered this strength will not be sustainable beyond the short term, and it now appears that the petrol and hybrid market is starting to cool as these cars look too expensive and use supply of these fuel types starts to increase. Also in recent months diesel values have in fact strengthened a little.
Demand Outlook
The outlook for the UK economy is uncertain in the context of Brexit but the consensus of the latest independent forecasts for GDP is no cause for alarm. Making decisions on interest rate changes based on % unemployment is far less reliable than it has been in the past and we are continuing to investigate whether we can usefully integrate any additional labour market metrics into our regression modelling (currently % unemployment is one of 15 labour market metrics studied). The unemployment rate remains low at 4%, and wage growth remains relatively slow by historic standards, especially given current labour market conditions.
Despite the base rate interest rate rise in August 2018 to 0.75%, interest rates are expected to remain low for the medium term. Any significant further increase in base rate still seem unlikely until there is a combination of further improvements in wage growth and increases in rates of headline inflation.
The latest figures for CPI and RPI are +2.4% and +3.6%, which are relatively stable.
Oil prices remain very hard to predict. During October 2016, the OPEC countries agreed to an initial cut production, which was then extended for a further 9 months and helped to ensure market stability. Now that supply is returning to levels commensurate with demand, oil prices are likely to rise steadily over the forecast period, but fuel prices will remain well below historic levels unless there are significant currency movements against the US Dollar.
Wage growth remains reasonably healthy, although slow by historical standards; and price inflation is now more stable; so these conditions should continue to provide a positive impetus to the overall economy.
Initial GDP results for Q4 2017 were +0.4%, indicating annual GDP for the whole of 2017 of around +1.7% (compared to 2.0% in 2016). Growth at the beginning of 2018 was sluggish, although appears to have picked up during the second quarter. Although preliminary estimates for Q2 are not currently available under the new reporting structure, the monthly indication of +0.3% for May implies further improvement, especially in the Services sector. Independent forecasts continue to indicate relatively stable growth rates throughout the next five years, with no organisation now predicting a recession within that period.
Consumer and Business Confidence had continued to increase slowly as we had expected, although post the Brexit referendum we now expect to see a decline in overall business investment, reversing the medium term trend, particularly in the large corporate sector. Much of the previous export growth was driven by the service sector, but this has slowed in recent months and there have also been increases in manufacturing and domestic car output. Much of this activity reflected the shift in export focus from the Eurozone to emerging economies and this is likely to continue, although exports remain below the long-term average. Despite the current state of Brexit negotiations, it is difficult to envisage a realistic scenario under which motor vehicles would not be part of a tariff free arrangement in the future.
Forecasts for future house price increases vary dramatically by sector and especially by geography. Despite a view expressed by the Bank of England’s Financial Stability Committee that the buy to let sector could “amplify” any boom or bust in the housing market, any negative effects are likely to be centred on London, with the rest of the country significantly more insulated from the impact of any such downturn.
Supply Outlook
Exchange rates are a major influence on the profitability of the UK new car market and they strongly influence eventual used vehicle volumes. Sterling rates against the Euro reduced as expected from around 1.43 in November 2015, to averaging 1.26 in April 2016 – equivalent to a -12% decrease in Euro revenue for the same vehicle sale - then fell further after the Brexit referendum to around 1.16 in early 2017 and settled at around 1.13 during the latter part of 2017, where they have broadly remained.
As a result, new car registrations for 2017 came in at 2.54M compared with 2016’s 2.69 million, with most of that fall coming from diesel registrations (down -17.1% year on year). We expect a further fall in registration volumes, especially for diesel, in 2018. Our view expressed at the start of 2018 was that total volumes will fall by around -3% to -4% compared to 2017, and this will result in a reduction in used car supply in future years and will help to support used values.
The UK economic situation looks likely to continue to offset any remaining weakness in the Eurozone and Sterling is set to remain at a level that should limit manufacturers’ scope for heavy discounting and forced registration activity.
New car registrations in other key European market continue to grow as a result of the release of pent up demand. In the three years before the financial crisis, France, Germany, Italy and Spain represented an annual combined volume of almost 9.4 million units, and have recovered to 7.7 million in 2015, then 8.3M in 2016, and then 8.7M in 2017, suggesting there is still further growth to come.
4. Gold Book Methodology:
Overview
All of our future residual values are based on the gold book methodology. Our values take current month black book values as a starting point (uplifted for model changes where necessary), are moved forward according to age/sector/fuel specific year on year deflation assumptions regarding future used car price movements, and are then subjected to additional adjustments by the Editorial Team. Finally, the values are moved forward by the next month’s seasonality adjustments which are differentiated by sector and fuel type and are based on analysis of historical black book movements.
All of these assumptions and adjustments are available for scrutiny to our customers through our gold book iQ product. For years our customers have been asking for transparency in automotive forecasting and we have delivered a ground-breaking product to provide exactly that.
With an increasing number of customers subscribing to gold book iQ, we are entering into a range of debates and discussions around both our overall forecasting methodology and individual elements of the forecasts for particular vehicles. This is expected to evolve over time into a ‘virtuous circle’, with the feedback looping back into the forecast process and delivering continuous improvement. We are embracing a new era of customer communication, with a greatly improved quality of interaction and debate around our forecast values.
Changes may be actioned wherever there is reason to do so outside of the sector reforecast process and we continue our monthly Interproduct analysis with our black book colleagues exactly as before. This has intensified following the availability of our short term forecast data (gold book 0-12, now available to customers), which incorporates detailed exception reporting at a cap hpi ID level and will also be used increasingly going forward to manage the relationships between black book and gold book.
Forecasting Model Development - gold book & iQ
gold book iQ was launched in December 2013 and gives unparalleled transparent insight into the assumptions used to produce our forecasts.
Our short term forecast product, gold book 0-12, (also marketed as black book +12) was launched shortly afterwards. This is a live, researched product with a dedicated editor and fills a gap in our previous forecast coverage.
Following feedback on our gold book iQ product, from September 2016 we have added more detail into the commentary for each model range reforecast in sector reviews.
In December 2017 we introduced a daily feed of forecasts for new models launched onto the market, so that customers do not have to wait until the next month to receive these forecasts.
Forecast Output
Individual forecasts are provided in pounds and percentage of list price for periods of twelve to sixty months with mileage calculations up to 200,000.
Each forecast is shown in grid format with specific time and mileage bands highlighted for ease of use.
All forecast values include VAT and relate to a cap hpi clean condition and in a desirable colour.
All new car prices in gold book include VAT and delivery.
Parallel Imports
Particular care must be taken when valuing parallel imports. Vehicles are often described as full UK specification when the reality is somewhat different. These vehicles should be inspected to ensure that the vehicle specification is correct for the UK. Parallel imports that are full UK specification and first registered in the UK can be valued the same as a UK-sourced vehicle.
Grey Imports
cap hpi gold book does not include valuations for any grey import vehicles, (i.e. those not available on an official UK price list).
5. Reforecast Calendar 2018/2019:
Monthly Product
Sector 1
Sector 2
Sector 3
Sector 4
Nov-18
Dec-18
Jan-19
Feb-19
Mar-19
Apr-19
May-19
June-19
Jul-19
Aug-19
Sep-19
Oct-19
SUV
Upper Medium
MPV
Lower Medium
City Car
SUV
Upper Medium
MPV
Lower Medium
City Car
SUV
Upper Medium
Electric
Executive
Convertible
Sports
Supermini
Electric
Executive
Convertible
Sports
Supermini
Electric
Executive
Large Executive
Coupe Cabriolet
Supercar
Large Executive
Coupe Cabriolet
Supercar
Large Executive
Luxury Executive
Luxury Executive
Large Executive

