
This is the editorial commentary to accompany the cap hpi guide to future residual values for used cars. This month the commentary has been restructured into the following sections, but the content and level of detail remains broadly the same as before.
- gold book forecast accuracy
- Forecast changes this month
- Market overview
- gold book methodology
- Reforecast calendar 2016/2017
In August, Andrew Mee took over the role of Senior Forecasting Editor (UK) from Dylan Setterfield who has moved into the role of International Forecasting Manager. Andrew has previous experience of residual value forecasting with leading leasing companies, and has spent the last few months working alongside Dylan prior to taking up the role. Dylan will continue to be involved for a further transition period and so we will ensure that forecasting process and accuracy will be unaffected. The other gold book team members (Jeff Knight, James Bisatt, and Rob Hester) will continue in their roles as before.
1. gold book Forecast Accuracy
As gold book matures since its introduction in December 2013, we have the data to enable us to measure our results in terms of forecast accuracy. The accuracy target widely demanded by our customers is to be within 5% of actual values and we are pleased that gold book has generally been within these limits at both the 12 month and 24 month points that we are currently able to measure.
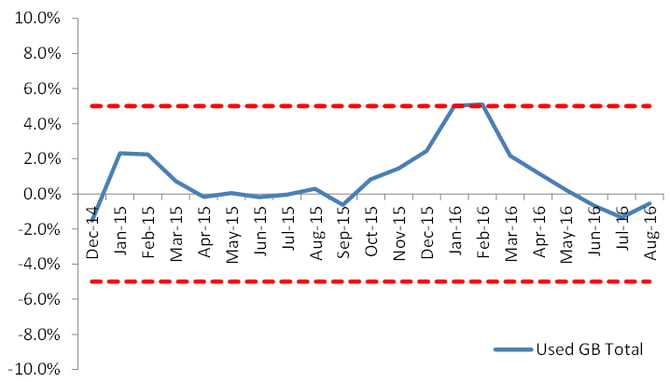
12 month results
Since measurement started our 12 month used forecasts have averaged +0.91% more than black book across all vehicle ids, and the most recent results show August 2015 12/20 gold book forecasts being -0.55% less than August 2016 12/20 black book.
 The latest 12/20 forecast differences for the major vehicle sectors are outlined below:
| Sectors | Average of gb Diff (%) |
| City Car | 7.7% |
| Executive | -0.8% |
| Lower Medium | 1.3% |
| MPV |
-1.4% |
| Supermini | 5.9% |
| SUV | -2.0% |
| Upper Medium | -4.2% |
| Grand Total | -0.5% |
It should be noted that although the percentages for City Car and Supermini are larger than for the other sectors and remain outside of the target, this is principally due to the lower value of the vehicles, especially for older vehicles. Accuracy improved recently due to the impact of last year’s significant forecast reductions in these sectors.
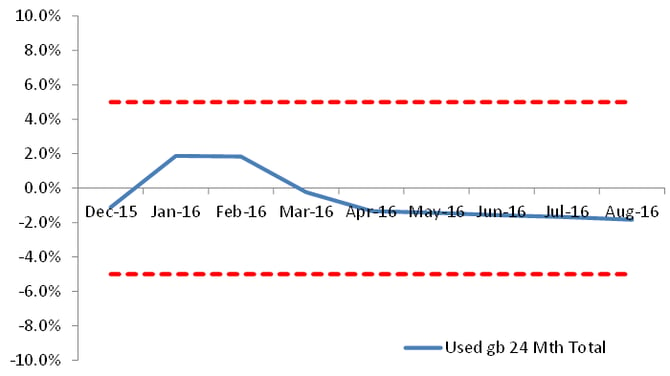
24 month results
Since measurement started our 24 month used forecasts have averaged -0.62% less than black book across all vehicle ids, and the most recent results show August 2014 24/40 gold book forecasts being -1.84% less than August 2016 24/40 black book.
Overall results
Although this remains the early stages, we continue to be extremely pleased with these initial results. We are taking advantage of our new methodology to implement a ‘virtuous feedback loop’, with each element of the forecast examined to determine how best to further improve the accuracy of our future value forecasts, while also reducing variation.
Our used market deflation (YOY%) assumptions, differentiated by age, vehicle sector and fuel type are still broadly in line with the current market at the vast majority of points.
We will continue to publish these results and share them with our customers.
2. Forecast changes this month:
This month, we publish our most recent reforecasts for the City Car and Supermini sectors. The overall reductions in underlying forecasts for these sectors are broadly in line with the deterioration seen in black book values for the sectors since the last review. For many model ranges, this deterioration is comparable to expectations of model aging and seasonality; but for some ranges the deterioration has been up to -7% worse that expectation. Forced registrations of some models have continued, with the surplus of late plate vehicles on the market continuing to push prices down. As a result we have made further reductions in forecast values, although in some cases we have retained a small level of positive adjustment under the assumption that some level of recovery is likely. In many more cases previous positive editorial adjustments have been removed – movements thought to be short term in nature have now been proved to be sustained over a longer period. Diesel premiums in these sectors continue to decrease in line with our previous expectation. We are still forecasting premiums for diesel over the equivalent petrol for most models at 36/60, but there are some exceptions where the relative oversupply of diesel has pushed values to below that of petrol.
Details of all assumptions and adjustments are available in gold book iQ.
3. Market Overview
During August, HM Treasury published the new independent medium term forecasts for the economy, all of which have been updated during the last two months. Analysis of this data shows it to be in line with our own view, with a slight reduction in GDP in 2017 but recovering thereafter. Not all ages and sectors of vehicle are directly impacted by GDP, and in some cases this will be offset by lower future registration volumes. Therefore we are planning to conform to our original timetable of sector reforecasts and do not consider it necessary to embark on wholesale reforecasts.
Following the vote to leave the EU, it is important to remember that this is just the beginning of a complicated process which will take at least 2 years to conclude with us actually ceasing to be an EU member, probably considerably longer. There were many untruths being peddled by both sides of the argument during the referendum campaign and many negative economic forecasts published which were based on us leaving the free trade area. This is highly unlikely. We expect some mildly negative effects on the economy in the short to medium term, due to reduced business capital expenditure and investment, but consumer spending to continue to drive a stable economy. More details are available through the blog release on our website and in an interview on Motor Trade Radio:
Impact of the referendum result
Saturday morning podcast [24/06/16 – 15m 30s onwards]
As predicted, we saw something close to a return to normal depreciation patterns for 2014 and 2015, after 2012 and 2013 were characterised by unusually low levels of depreciation due to low levels of supply of used cars. Our research has shown that three and four-year-old prices for many vehicle sectors are closely linked to the level of fleet registrations (+8.0% YOY in 2014 and a further +12.3% in 2015), either overall or for the individual vehicle sector and these will also tend to be driven by business need (rather than the availability of offers which had driven the exceptional new car retail growth in 2013 and early 2014). Fleet registrations have been increasing since falling in 2008/9 and although we predicted a record year for 2015, the final total was bolstered by an extreme level of manufacturer forced registrations, through a variety of means. As previously indicated, there have been a number of model specific adjustments made to gold book forecasts, to reflect the detrimental effect of this kind of activity on used values.
As leasing returns increase and more nearly new cars return to the used marketplace, values are broadly expected to decrease in line with previous seasonal aging patterns, with positive impact from the improving economy broadly mitigating the effect of increased supply. The rate of retail growth has slowed considerably (remaining around +2% through Q4 2015), whereas fleet registrations have continued to grow at an increasing rate (overall +12%, although the underlying ‘true’ growth rate appears to have peaked some time ago).
In the coming months, used car supply is expected to increase further, however in general we do not expect to see significant decreases in three or four-year-old values in the next 12 months over and above typical model aging patterns, with supply and demand remaining broadly in balance. Our forecasts incorporate the effect of increased registrations on individual sectors, with variation in the level of impact and which part of the market the sectors are sensitive to.
Over the next 12 months, the biggest threat to used prices of younger cars is the continued pursuit of forced registrations by manufacturers, chasing the market share levels which were fuelled by lower than expected new car volumes across the Eurozone in recent years. The slowdown in growth in China and collapse of the new car market in Russia could also contribute to pressure for some manufacturers to register more volume in the UK. Although the majority are much more focussed on residual value protection than they were several years ago and tend to manage disposals much more responsibly than in the past, the changes in used and forecast values for the City Car and Supermini sectors reflects the increasing volumes involved. This effect has been far less pronounced to date in most other vehicle sectors, but they may not stay immune from the effects should the forced registration activity continue through 2016.
Demand Outlook
The outlook for the UK economy remains one of a sustained period of modest growth, with previously bullish Bank of England forecasts now revised down and much closer to the independent average. Making decisions on interest rate changes based on % unemployment is far less reliable than it has been in the past and we are continuing to investigate whether we can usefully integrate any additional labour market metrics into our regression modelling (currently % unemployment is one of 15 labour market metrics studied). Numbers of unemployed and those “economically inactive” continue to decrease at the same time, which is a phenomenon rarely seen in the past. Although the level of unemployed increased slightly for the first time in 12 months, the unemployment rate remained at 4.9%, but wage growth remains relatively slow by historic standards, especially given current labour market conditions.
On this basis, interest rates are expected to remain low for the medium term. Forward guidance from the Bank of England continues to be inconsistent. At the latest meeting, members of the MPC surprised some by voting against a rate cut, although the indications are that a minimal reduction will follow in September, with timing of an initial increase now more difficult to predict than before following the EU referendum vote. Any significant increases in base rates still seem unlikely until there is a combination of further improvements in wage growth and increases in rates of headline inflation.
CPI continues to remain low at +0.6% (up from +0.5% the previous month), partly due to fuel price rises (although there are now conflicting pressures from a lower sterling exchange rate and lower US$ oil prices). CPI remains well below the Bank of England’s target of 2% and the index looks like to remain below 1% until at least the fourth quarter, or probably beyond. Oil prices remain very hard to predict, with the situation changing on an almost daily basis. The glut of production from leading OPEC countries is unsustainable even in the medium term and it remains to be seen whether this action will be enough to force small producers out of the market. Once supply returns to levels commensurate with demand, oil prices are likely to rise steadily over the forecast period, but fuel prices will remain well below historic levels unless there are further significant currency movements against the US Dollar. CPI has remained virtually flat for more than a year and RPI is at 1.6%. Wage growth remains reasonably healthy, although slow by historical standards, although if earnings continue to outstrip price inflation as expected, then that will continue to provide a positive impetus to the overall economy.
Having already been deferred on several occasions, the reversal of Quantative Easing is not expected “for some time” and MPC proposals on increasing the level of QE have been unanimously voted down.
GDP growth for the UK appears to have been relatively consistent over the past 3 quarters: Q415 +0.5, Q116 +0.4, Q216 +0.5 (latest Bank of England MPC estimate). Industrial and manufacturing output have continued to decline in recent months, prompting fears of a further slowdown, but services continue to grow and annual GDP for 2016 is still expected to remain positive, despite some pessimistic forecasts from some quarters. The next publication of independent forecasts by HM Treasury will be studied in great detail, although it seems that the biggest reductions in forecasts have come from those who were originally much more bullish about the UK economy’s prospects than the central projection.
Consumer and Business Confidence had continued to slowly increase as we had expected, although we now expect to see a decline in overall business investment, reversing the recent trend, particularly in the large corporate sector. Much of the previous export growth was driven by the service sector, but this has slowed in recent months and there have also been increases in manufacturing and domestic car output. Much of this activity reflected the shift in export focus from the Eurozone to emerging economies and this is likely to continue, despite fluctuating Eurozone demand (see below), although exports still remain below the long term average. The UK will remain within the European Economic Area for the foreseeable future and it is difficult to envisage a realistic scenario where this would not continue to be the case in future.
Forecasts for future house price increases vary dramatically by sector and especially by geography. Despite a view expressed by the Bank of England’s Financial Stability Committee that the buy to let sector could “amplify” any boom or bust in the housing market, any negative effects are likely to be centred around London, with the rest of the country significantly more insulated from the impact of any such downturn. The ‘new powers’ being proposed are unlikely to have any significant impact as the buy to let market is expected to reduce following previous tax measures announced by the government.
Supply Outlook
New car registrations for 2015 came in at 2.633 million, with short cycle volumes and forced registrations a significant factor for several manufacturers in the final weeks of the year. We originally expected the 2016 total to be slightly lower than 2015, with growth faltering from the second quarter onwards. Indeed, despite several bullish articles in the national and trade press regarding the headline figures, several vehicle sectors were already running at below 2015 levels before the EU referendum. We expect to see continuing impact on 1 year old values in the next few months as forced registrations enter the used market in larger volumes and we have applied a number of specific model adjustments in gold book which have been outlined in gold book iQ. If any manufacturers continue to pursue market share at the expense of profitability, then the impact on used values will continue to worsen.
Exchange rates are a major influence on the profitability of the UK new car market and they strongly influence eventual used vehicle volumes. The rates for Sterling against the Euro had gradually decreased as we expected, following the short term impact of the announcement regarding the commencement of Quantative Easing by the ECB and the conclusion of the last round of bail-out discussions in Greece. In recent months, rates had already reduced as expected from around 1.43 6 months ago, to averaging 1.28 in May – equivalent to a -10.5% decrease in Euro revenue for the same vehicle sale, and then averaging 1.17 in August. We had expected further modest short term reductions before a more gradual decrease in the Sterling rate against the Euro over the next 3 years, as growth continues to pick up in mainland Europe. Much of the most recent currency fluctuations are likely to be short term in nature and Sterling has steadily recovered from its low point against the Euro in the first week of July.
The UK economic situation looks likely to continue to offset any remaining weakness in the Eurozone and Sterling is set to remain at a level which should limit manufacturers’ scope for heavy discounting in the UK for the second half of this year. The 2015 total for the EU as a whole was up over 2014 (13.7 vs 12.55 million units), but economic improvement is needed to sustain this over the next few years.
Results for 2015 were encouraging, showing simultaneous growth in the biggest 5 markets for the first time in several years and we could be on the verge of a significant release of pent up demand in 2016 as momentum is finally regained in the major markets. Spain may well slow in 2016 following the removal of scrappage incentives, but the key markets in Germany and France now appear to be growing steadily.
4. Gold Book Methodology:
Overview
All of our future residual values are based on the gold book methodology. Our values take current month black book values as a starting point (uplifted for model changes where necessary), are moved forward according to age/sector/fuel specific year on year deflation assumptions regarding future used car price movements, and are then subjected to additional adjustments by the Editorial Team. Finally the values are moved forward by the next month’s seasonality adjustments which are differentiated by sector and fuel type and are based on analysis of historical black book movements.
All of these assumptions and adjustments are available for scrutiny to our customers through our gold book iQ product. For years our customers have been asking for transparency in automotive forecasting and we have delivered a ground-breaking product to provide exactly that.
With an increasing number of customers subscribing to gold book iQ, we are entering into a range of debates and discussions around both our overall forecasting methodology and individual elements of the forecasts for particular vehicles. This is expected to evolve over time into a ‘virtuous circle’, with the feedback looping back into the forecast process and delivering continuous improvement. We are embracing a new era of customer communication, with a greatly improved quality of interaction and debate around our forecast values.
A cycle of changes to our seasonality assumptions was completed in summer 2016 and these assumptions will be reviewed again within approximately 12 months’ time.
Changes may be actioned wherever there is reason to do so outside of the sector reforecast process and we continue our monthly Interproduct analysis with our black book colleagues exactly as before. This has intensified following the availability of our short term forecast data (gold book 0-12, now available to customers), which incorporates detailed exception reporting at a cap hpi ID level and will also be used increasingly going forward to manage the relationships between black book and gold book.
Our used gold book methodology was designed to feature 5 mileage bandings (rather than the 3 bandings which have traditionally been published) and the mileages tabulated in our database are now much more relevant to the age of the individual vehicle and are differentiated by sector and fuel type. Our used forecasts are also now available out for 5 years into the future for all vehicles currently up to 5 years old today. Our Windows, ASCII and SQL products remain technically the same, with the only changes being the methodology behind the forecast data and the selected mileages which are tabulated.
Forecasting Model Development – gold book & iQ
gold book iQ was launched in December 2013. The feedback from customers to date has been extremely positive and we believe gold book iQ will represent a new benchmark in truly market leading forecasting. More details are available here: http://business.cap.co.uk/products-and-services/gold-book-iQ
Our short term forecast product, gold book 0-12, (also marketed as black book +12) has now been launched and is available to customers. This is a live, researched product with a dedicated Editor (Rob Hester) and fills a gap in our previous forecast coverage. See link to a previous podcast:
http://www.cap.co.uk/en/cap-extras/its-the-saturday-morning-meeting-on-motor-trade-radio/
Forecast Output
Individual forecasts are provided in pounds and percentage of list price for periods of twelve to sixty months with mileage calculations up to 200,000.
Each forecast is shown in grid format with specific time and mileage bands highlighted for ease of use.
All forecast values include VAT and relate to a cap hpi clean condition and in a desirable colour.
5. Reforecast Calendar 2016/2017:
| Monthly Product | Sector 1 | Sector 2 | Sector 3 | Sector 4 |
| Oct-16 | SUV | Electric | ||
| Nov-16 | Upper Medium | Executive | Large Executive | Luxury Executive |
| Dec-16 | MPV | Convertible | Coupe Cabriolet | |
| Jan-17 | Lower Medium | Sports | Supercar | |
| Feb – 17 | City Car | Supermini | ||
| Mar-17 | SUV | Electric | ||
| Apr-17 | Upper Medium | Executive | Large Executive | Luxury Executive |
| May-17 | MPV | Convertible | Coupe Cabriolet | |
| Jun-17 | Lower Medium | Sports | Supercar | |
| Jul-17 | City Car | Supermini | ||
| Aug-17 | SUV | Electric | ||
| Sep-17 | Upper Medium | Executive | Large Executive | Luxury Executive |
APPENDIX:
Parallel Imports
Particular care must be taken when valuing parallel imports. Vehicles are often described as full UK specification when the reality is somewhat different. These vehicles should be inspected to ensure that the vehicle specification is correct for the UK. Parallel imports that are full UK specification and first registered in the UK can be valued the same as a UK-sourced vehicle.
Grey Imports
cap hpi gold book does not include valuations for any grey import vehicles, (i.e. those not available on an official UK price list).
New Prices
All new car prices in gold book include VAT and delivery.

