
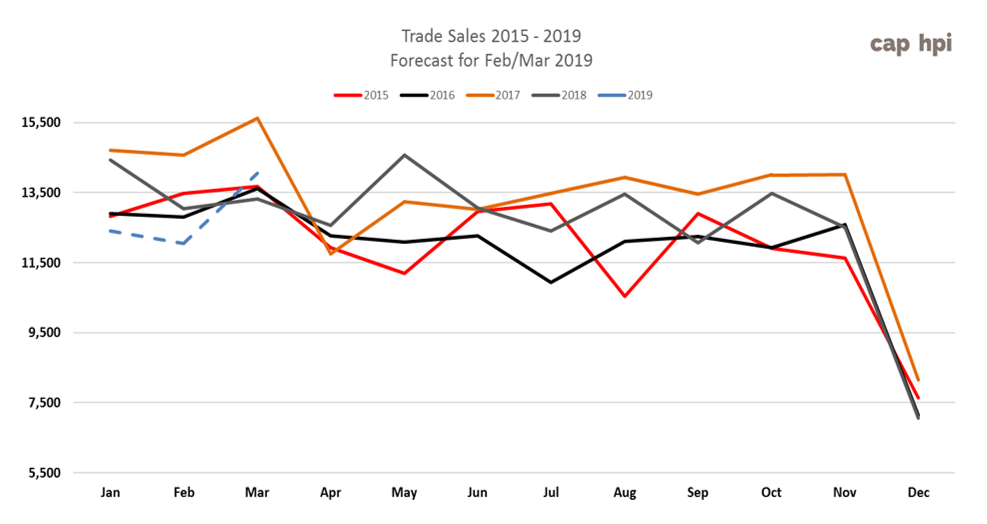
As we suggested in last month’s edition, the slow start to the year was short lived as overall sales volumes for February swiftly climbed back to pre-Christmas holiday levels, mirroring the trends we have been witnessing over recent years. A distinct change in market sentiment was noticeable on the ground at the auctions we attended from around the second week in January where the mood was generally upbeat and professional buyers were out in force with many of them buying in multiples.
The apparent resurgence in sales was more than matched by the increased availability of used LCV stock. Although we tend to see this every January, as vendors offload stock that has built-up during December, this year stock levels were particularly high which resulted in some very large auction sales. Interestingly, as the chart below clearly shows, the spike in supply during the third week in January was actually greater than the one we saw during May 2018. The high number of auction entries was due to the culmination of freak weather conditions and an unexpected large de-fleet. The so-called “Beast from the East”, which began during the last week of February 2018 and lasted eight days, brought parts of the country to a standstill. This severely disrupted the transportation of vehicles to and from auctions. Then at the end of March we saw the collapse of a large vehicle rental company in Scotland which had a huge impact on stock levels.
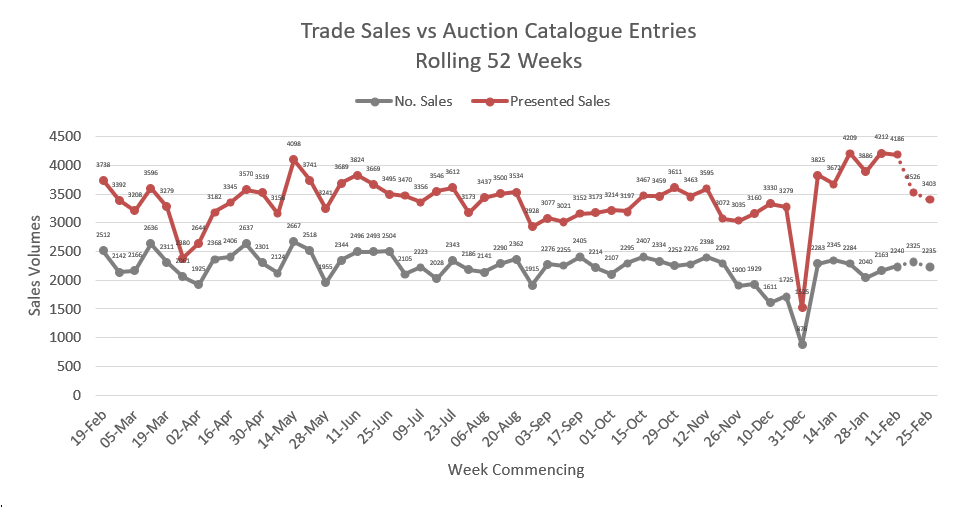
We are currently forecasting that the widening gap we saw between catalogue entries and vehicles sold during January will continue to close as we move towards the end of the first quarter.
Supply: February Auction Catalogue Entries
Analysis of the auction sale catalogues reveals that February auction entries increased by 27% compared to January. The average age of vehicles increased slightly from 59 months to 60 month and the average recorded mileage increased from 75,684 to 79,998.
|
Mar-18 |
Apr-18 |
May-18 |
Jun-18 |
Jul-18 |
Aug-18 |
Sep-18 |
Oct-18 |
Nov-18 |
Dec-18 |
Jan-19 |
Feb-19 |
|
|
Auction Entries % Var |
-16% |
-9% |
25% |
-3% |
3.60% |
0% |
-14% |
8% |
3.50% |
23% |
31% |
27% |
|
Re-Entries |
21.74% |
19.00% |
22.96% |
27.65% |
31.18% |
28.04% |
24.48% |
24.61% |
26.51% |
31.42% |
30.92% |
29.72% |
|
New Entries |
78.26% |
81.00% |
77.04% |
72.35% |
68.82% |
71.96% |
75.52% |
75.39% |
73.49% |
68.58% |
69.08% |
70.28% |
|
Average age (Months) |
61 |
64 |
63 |
61 |
60 |
61 |
61 |
60 |
63 |
63 |
59 |
60 |
|
Average Mileage |
75,676 |
76,127 |
75,780 |
74,631 |
76,993 |
76,087 |
74,994 |
75,074 |
78,883 |
78,312 |
75,974 |
75,974 |
New LCV Registrations: Relevance in the used LCV Market
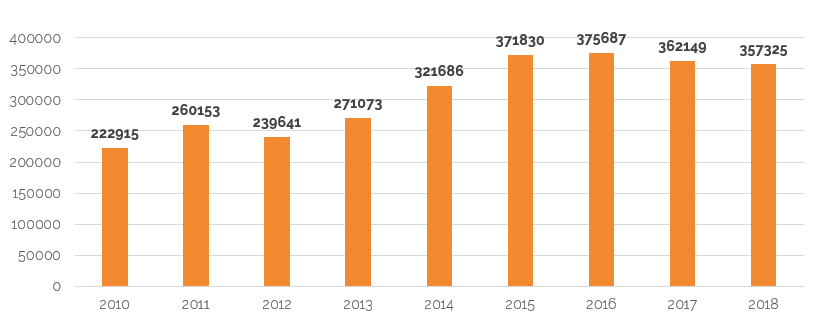
As those who have a watchful eye on the SMMTs reports on new LCV registrations will be well aware, there has been a considerable decline in the growth of new LCVs sales over the past two years. Compared to the peak in 2016, new registrations in 2017 were down by 13,538 and by 18,362 in 2018.
It is widely accepted that continuing low GDP Growth and economic uncertainty has taken a heavy toll on the new LCV market as operators of all fleet sizes have been forced to review their vehicle replacement cycles. It’s becoming increasingly likely that, further down the timeline, the used LCV market faces a double-edged sword of a shrinking parc of 1 to 3 year old vehicles as registrations fall and increasingly more large fleets and SMEs operators deferring vehicle replacement and extending leasing contracts.
With this in mind there is a view that professional used LCV buyers in particular are pre-empting that stock shortages are on their way and are effectively buying up vehicles whilst they still can.
Whilst there may well be an element of truth in this, as sales volumes were certainly healthy last month, from our observations at auctions, and from the sales research data we collect, we couldn’t help but notice that there was a distinct change in market sentiment with regard to condition and prices generally. Whilst we could hardly describe the market as bearish based on a single month of trading, at times it seemed to be heading in that direction as discerning professional buyers were clearly no longer prepared to pay current market prices for vehicles which had even the slightest amount of damage.
Sales Performance by Sector
December 2018
January 2019
February 2019
LCV Sector
Market Share
Performance
Market Share
Performance
Market Share
Performance
City Van
5.20%
99.08%
4.37%
99.86%
3.55%
100.28%
Small Van
22.72%
99.86%
23.41%
99.04%
23.18%
100.21%
Medium Van
30.39%
100.14%
32.97%
99.26%
29.78%
101.20%
Large Van
17.77%
98.55%
16.89%
97.14%
19.95%
99.00%
Over 3.5T
0.33%
99.83%
0.37%
99.02%
0.35%
99.30%
4x4 Pick-up Workhorse
2.70%
98.64%
2.37%
100.08%
1.99%
100.13%
4x4 Pick-up Lifestyle SUV
12.49%
99.29%
11.95%
99.76%
11.81%
101.18%
Forward Control Vehicle
0.38%
94.63%
0.17%
94.00%
0.22%
97.68%
Chassis - Derived
5.62%
96.71%
4.90%
96.05%
6.19%
98.56%
Mini-bus
0.51%
94.15%
0.50%
100.72%
0.39%
103.27%
Vat Qualifying
1.58%
99.27%
1.77%
100.24%
2.48%
98.75%
Total Market
100.00%
99.34%
100.00%
98.83%
100.00%
100.24%
With demand so strong last month, it’s no surprise that the overall price performance across all sectors was just over 100%. As always though, as we delved deeper into our research data we uncovered both strengths and weaknesses in some model ranges and these have been reflected in the guide price adjustments we’ve made in this edition.
LCV Used Guide Price Movements 3 year/60k
January 2019
February 2019
March 2019
LCV Sector
Average % Movement
Average £ Movement
Average % Movement
Average £ Movement
Average % Movement
Average £ Movement
City Van
-0.8%
-£28
-1.4%
-£52
-2.9%
-£103
Small Van
-0.5%
-£28
-2.8%
-£141
-1.3%
-£64
Medium Van
-1.6%
-£169
-1.9%
-£189
0.3%
£28
Large Van
-2.1%
-£183
-3.3%
-£289
-3.7%
-£313
Over 3.5T
-1.8%
-£202
-3.6%
-£394
-1.8%
-£192
4x4 Pick-up Workhorse
-0.3%
-£34
-0.5%
-£60
1.6%
£193
4x4 Pick-up Lifestyle SUV
-0.6%
-£70
-0.6%
-£70
-0.6%
-£70
Forward Control Vehicle
-1.2%
-£139
-1.8%
-£208
-0.8%
-£91
Chassis - Derived
-1.3%
-£128
-4.1%
-£389
-2.5%
-£234
Mini-bus
-4.1%
-£460
-0.8%
-£95
2.1%
£248
Vat Qualifying
-0.4%
-£51
-0.3%
-£31
-0.8%
-£98
We’ve made some changes to this chart in this edition as it now shows the historic price adjustments over the past three months. The average percentage and monetary movements are intended to give a brief indication of the price adjustments we’ve made to models in each sector at 3yr/60k miles. It’s not intended as a guide for specific vehicle valuations.
Updated - Vehicle Colour/Price Guide
Whilst auction catalogue entries always specify colour, it’s the guide values of White vans that you will see printed in the auction catalogues.
Every month in this editorial we remind our subscribers that the published guide values are for standard vehicles in plain white as they appear in the vehicle manufacturer’s price lists.
It’s widely accepted within the remarketing industry that age, mileage and condition aren’t the only factors that can affect how much a used vehicle is worth, colour is extremely important too. Whilst traditionally there have been fewer standard colours to choose from when buying a commercial vehicle, over recent years that’s changed as vehicle manufacturers have responded to a growing demand for vehicles in a much greater range of colours. Some manufacturer’s will also supply vehicles factory-painted in corporate colours to fulfil certain large fleet orders adding even more colours into the mix of vehicles which eventually come back into the used LCV market.
Whilst white remains the colour choice for most new LCV buyers, increasingly we are seeing more and more vans in other colours entering the used market. The chart below is intended as a guide to illustrate how more or less in percentage terms you would expect to pay for a vehicle in any of the colours listed. For example, if you were bidding on a Silver van in the City Van sector you can expect to pay on average 1.88% more than you’d pay for the same van in White. The values shown in this table are based on actual trade sales of vehicles at open auctions and that at any given time the market values of vehicles are dependent on many other factors such as supply volume and condition.
|
Colours |
City Van |
Small Van |
Medium Van |
Large Van |
4x4 Workhorse |
4x4 Lifestyle |
Mini-bus |
VAT Qualifying |
|
White |
cap Average |
cap Average |
cap Average |
cap Average |
cap Average |
cap Average |
cap Average |
cap Average |
|
Silver |
1.88% |
3.48% |
2.60% |
4.58% |
1.95% |
1.02% |
-0.94% |
1.81% |
|
Blue |
-0.19% |
0.44% |
2.61% |
1.04% |
1.38% |
1.08% |
-2.46% |
1.73% |
|
Black |
3.64% |
4.44% |
3.68% |
3.39% |
2.19% |
0.99% |
3.96% |
|
|
Grey |
4.85% |
5.74% |
4.34% |
3.53% |
2.78% |
1.38% |
4.50% |
|
|
Red |
0.71% |
-0.51% |
1.62% |
-1.32% |
1.63% |
0.31% |
2.43% |
|
|
Yellow |
-4.23% |
-4.24% |
-6.32% |
-7.72% |
||||
|
Green |
-0.45% |
-3.98% |
-2.88% |
-2.37% |
2.10% |
0.79% |
5.15% |
|
|
Orange |
0.26% |
8.60% |
0.79% |
1.64% |
||||
|
Brown |
1.17% |
1.95% |
-0.94% |
Top 10 models driving the used LCV Market
The Top 10 tables below give you a clear picture of the makes and models in the main LCV sectors that are driving prices in the used LCV Market. Arranged in order of their respective share of total sector sales, the percentage CAP performance is based on actual recorded sales at open auctions.
Since our guide values reflect the market prices of basic vans in plain white as they appear in the vehicle manufacturer’s price lists, some of the guide price movements you might see in this edition may not correlate directly with the sales performances shown in the tables since these include vehicles in all colours and specifications. Also, as part of process for reviewing guide prices we take into account condition and the weighting effect that stock availability and sales volume might have on price.
The commentary contained within the Top 10 Tables is intended to give an overview of any sector level price adjustments we have made in this edition along with specific items of interest that we noted whilst attending auctions and analysing our sales research data.
We also include an exception list of model ranges which have had individual price adjustments. The percentage value in square brackets at the end of each of the model range names listed in the table indicates any individual price change we’ve made in this edition.
|
CAPId |
City Van |
Sector Share |
%CAP |
%CAP White Only Condition Adjusted |
||||||||||||||||||||||||
|
26326 |
FIESTA DIESEL - 1.6 TDCi ECOnetic Van |
8.92% |
100.7% |
101.8% |
||||||||||||||||||||||||
|
26324 |
FIESTA DIESEL - 1.5 TDCi Van |
8.62% |
97.3% |
97.9% |
||||||||||||||||||||||||
|
24217 |
NEMO DIESEL - 1.3 HDi Enterprise [non Start/Stop] |
7.08% |
107.5% |
94.6% |
||||||||||||||||||||||||
|
26328 |
FIESTA DIESEL - 1.6 TDCi Sport Van |
5.23% |
105.1% |
105.8% |
||||||||||||||||||||||||
|
24216 |
NEMO DIESEL - 1.3 HDi LX [non Start/Stop] |
4.62% |
100.5% |
98.0% |
||||||||||||||||||||||||
|
34795 |
BIPPER DIESEL - 1.3 HDi 75 Professional [Nav] [non Start/Stop] |
4.62% |
102.6% |
96.3% |
||||||||||||||||||||||||
|
24233 |
BIPPER DIESEL - 1.3 HDi 75 Professional [non Start/Stop] |
3.38% |
105.0% |
102.4% |
||||||||||||||||||||||||
|
24229 |
BIPPER DIESEL - 1.3 HDi 75 S [SLD] [non Start/Stop] |
2.77% |
95.6% |
99.3% |
||||||||||||||||||||||||
|
30871 |
TRANSIT COURIER DIESEL - 1.5 TDCi Trend Van |
2.46% |
110.5% |
105.6% |
||||||||||||||||||||||||
|
11121 |
CORSAVAN DIESEL - 1.3 CDTi 16V Van |
2.46% |
65.5% |
100.0% |
||||||||||||||||||||||||
|
The City Van sector market share was down again last month by just under 1% whilst the average sales price performance was up marginally from 99.86% to 100.28%. Whilst there were noticeably more Fiesta in the model mix last month, overall stock levels remained relatively low in this sector which may be a factor that’s helping prices to hold firm. Overall the guide prices have moved down by around 1% in this edition in order to reflect plate-age depreciation, however, there are a large number of exceptions worth noting this month, as listed below. Also note that some of the larger downward percentage movements have been applied to older model ranges where the average monetary values involved are much lower.
|
||||||||||||||||||||||||||||
|
CAPId |
Small Van |
Sector Share |
%CAP |
%CAP White Only Condition Adjusted |
||||||||||||||||||||||||||||||||||||
|
18445 |
BERLINGO L1 DIESEL - 1.6 HDi 625Kg Enterprise 75ps |
7.30% |
107.5% |
104.2% |
||||||||||||||||||||||||||||||||||||
|
34164 |
DOBLO CARGO L1 DIESEL - 1.3 Multijet 16V Van |
3.91% |
94.4% |
94.2% |
||||||||||||||||||||||||||||||||||||
|
26672 |
TRANSIT CONNECT 200 L1 DIESEL - 1.6 TDCi 75ps Van |
3.02% |
97.5% |
97.3% |
||||||||||||||||||||||||||||||||||||
|
28276 |
CADDY MAXI C20 DIESEL - 1.6 TDI 102PS Startline Van |
2.92% |
96.6% |
95.5% |
||||||||||||||||||||||||||||||||||||
|
24235 |
COMBO L1 DIESEL - 2000 1.3 CDTI 16V ecoFLEX H1 Van |
2.55% |
91.1% |
97.1% |
||||||||||||||||||||||||||||||||||||
|
24234 |
COMBO L1 DIESEL - 2000 1.3 CDTI 16V H1 Van |
2.40% |
93.8% |
97.2% |
||||||||||||||||||||||||||||||||||||
|
38471 |
BERLINGO L1 DIESEL - 1.6 BlueHDi 625Kg Enterprise 75ps |
2.40% |
102.4% |
103.3% |
||||||||||||||||||||||||||||||||||||
|
28266 |
CADDY C20 DIESEL - 1.6 TDI 102PS Startline Van |
2.03% |
102.1% |
94.6% |
||||||||||||||||||||||||||||||||||||
|
24257 |
COMBO L2 DIESEL - 2300 1.3 CDTI 16V ecoFLEX H1 Van |
1.98% |
72.8% |
91.7% |
||||||||||||||||||||||||||||||||||||
|
22432 |
PARTNER L1 DIESEL - 850 S 1.6 HDi 92 Van [SLD] |
1.98% |
94.0% |
95.4% |
||||||||||||||||||||||||||||||||||||
|
The sector share of Small Van sales was only marginally down compared to last month at 23.18% whilst the average sales performance improved by just under 1.2% to 100.21%. However, close examination of our research data revealed that further adjustments were necessary to some models ranges and these are listed below.
Old shape Ford Connect are appearing at auction in much lower numbers than we saw in their heyday but outnumbered the new shape Connect last month. Whilst many of the old shape models presented for sale have seen better days it doesn’t seem to be having much of an impact on their market prices. Unfortunately for this model, damage in the area of the lower body side panels and doors are costly to repair due to the panel swage line design and, those that have been repaired are easy to spot and hardly ever look right. This doesn’t appear to be deterring buyers though as we saw reasonable numbers of both the 2002-2009 and 2009-2013 models both of which over-performed against the guide vales. However, the high roof 230 models appear to be less popular with buyers and they continue to struggle against the guide prices.
|
||||||||||||||||||||||||||||||||||||||||
CAPId
Medium Van
Sector Share
%CAP
%CAP White Only Condition Adjusted
25446
TRANSIT CUSTOM 290 L1 DIESEL FWD - 2.2 TDCi 100ps Low Roof Van
2.59%
100.4%
98.5%
25437
TRANSIT CUSTOM 270 L1 DIESEL FWD - 2.2 TDCi 100ps Low Roof Van
2.55%
95.9%
99.2%
25441
TRANSIT CUSTOM 270 L1 DIESEL FWD - 2.2 TDCi 125ps Low Roof Limited Van
2.51%
102.0%
100.6%
31669
VIVARO L2 DIESEL - 2900 1.6CDTI 115PS Sportive H1 Van
2.35%
98.4%
97.3%
31668
VIVARO L2 DIESEL - 2900 1.6CDTI 115PS H1 Van
2.19%
96.3%
96.5%
26570
TRANSIT CUSTOM 270 L1 DIESEL FWD - 2.2 TDCi 100ps Low Roof Van ECOnetic
1.99%
100.4%
100.9%
18442
DISPATCH L1 DIESEL - 1000 1.6 HDi 90 H1 Van Enterprise
1.83%
103.0%
98.8%
25449
TRANSIT CUSTOM 290 L1 DIESEL FWD - 2.2 TDCi 125ps Low Roof Trend Van
1.59%
105.6%
100.8%
31586
TRAFIC SWB DIESEL - SL27dCi 115 Business+ Van
1.51%
98.4%
95.5%
25458
TRANSIT CUSTOM 310 L1 DIESEL FWD - 2.2 TDCi 125ps Low Roof Van
1.51%
91.8%
The Medium Van sector share of total LCV sales was down by just under 3.2% last month whilst the average price performance against the guide was up by just under 2%. We have applied a downward price movement of just under 1% to most models in this sector to allow for plate-age depreciation. There have also been some significant price movements applied to the individual ranges listed below.
Transit Custom continues to dominate what is the largest and most complex of all the LCV sectors in terms of the sheer sales volumes and model variations. Arguably, such high volumes of certain models and scarcity of others could be having a knock on effect in that buyers are prepared to bid higher for some of the less popular makes and models because of their rarity.
M-B VITO E6 (15- ) CDi VAN [-3.8%]
VW T6 TRANSPORTER (15-16) VAN [1.2%]
NISSAN PRIMASTAR (06-15) dCI VAN [-2.8%]
M-B VITO (03-10) CDi VAN [-4.8%]
RENAULT TRAFIC E6 (16- ) dCi VAN [-4.8%]
M-B VITO (03-10) DUALINER VAN [-4.8%]
TOYOTA PROACE E6 (16- ) VAN [3.2%]
RENAULT TRAFIC (06-14) dCi VAN [-2.8%]
VAUXHALL VIVARO E6 (16- ) VAN [-2.8%]
VW T5 TRANSPORTER (10-15) VAN [1.2%]
VW T6 TRANSPORTER E6 (16- ) VAN [1.2%]
M-B VITO (05-07) PET VAN [-4.8%]
VW T6 TRANSPORTER PETROL (16-19) VAN [1.2%]
RENAULT TRAFIC (01-06) dCi VAN [-5.8%]
CITROEN DISPATCH (07-16) VAN [-1.8%]
RENAULT TRAFIC (01-07) PET VAN [-5.8%]
PEUGEOT EXPERT (07-16) VAN [-2.8%]
VAUXHALL VIVARO (06-11) VAN [-1.8%]
RENAULT TRAFIC (14-16) dCi VAN [-2.8%]
VW T4 TRANSPORTER (96-04) VAN [1.2%]
TOYOTA PROACE (12-16) VAN [-2.8%]
VW T5 TRANSPORTER (03-10) VAN [1.2%]
CAPId
Large Van
Sector Share
%CAP
%CAP White Only Condition Adjusted
26863
SPRINTER 313CDI LONG DIESEL - 3.5t High Roof Van
6.38%
84.6%
98.8%
30637
TRANSIT 350 L3 DIESEL RWD - 2.2 TDCi 125ps H3 Van
3.97%
97.6%
98.8%
30630
TRANSIT 350 L3 DIESEL RWD - 2.2 TDCi 125ps H2 Van
2.76%
99.5%
99.7%
33533
MASTER LWB DIESEL FWD - LM35dCi 125 Business Medium Roof Van
2.76%
99.1%
99.6%
21705
CRAFTER CR35 LWB DIESEL - 2.0 TDI 136PS High Roof Van
2.53%
99.0%
99.2%
30646
TRANSIT 350 L4 DIESEL RWD - 2.2 TDCi 125ps H3 Van
2.13%
101.3%
100.1%
31707
BOXER 335 L3 DIESEL - 2.2 HDi H2 Professional Van 130ps
2.13%
100.5%
100.3%
36948
SPRINTER 314CDI LONG DIESEL - 3.5t High Roof Van
2.01%
98.3%
98.4%
21703
CRAFTER CR35 LWB DIESEL - 2.0 TDI 109PS High Roof Van
1.95%
95.1%
98.6%
31217
RELAY 35 L3 DIESEL - 2.2 HDi H2 Van 130ps Enterprise
1.84%
99.2%
98.8%
The sector market share of Large Vans increased by just over 3.5% last month whilst the average price performance against the guide improved by just under 2%. A downward price adjustment of just under 1% has been applied to most models in this sector apart from the model ranges listed below.
Most noticeable at auctions last month was the large number of Luton bodied 3.5t vehicles listed in the sale catalogues; there were almost twice as many on sale last month as there were in November 2018. Most of these are from the rental market segment and there is a definite split between the conventional Luton body type mounted on a chassis cab and the ‘Renault Lo-Loader type’, which are built on a platform cab and have the huge benefit of a low-height load-floor. The sales volumes we have been seeing would suggest a very low conversion rate for this vehicle type. Clearly the conventional type Luton bodied vehicles that don’t have a tail-lift fitted are proving to be less desirable especially as there are so many of the low load-floor type currently in the market.
FIAT DUCATO (14- ) VAN [-4.8%]
PEUGEOT BOXER (06-14) VAN [1.2%]
FORD TRANSIT E6 (16- ) T290 - T350 VAN [2.2%]
RENAULT MASTER (03-10) dCi VAN [-2.8%]
IVECO DAILY E6 (14- ) VAN [-1.8%]
RENAULT MASTER (04-05) RWD VAN [-2.8%]
LDV E5 (16- ) VAN [-4.8%]
RENAULT TRUCKS MASTER (10-15) VAN [-2.8%]
M-B SPRINTER E6 (18- ) 2-SERIES VAN [1.2%]
VAUXHALL MOVANO (03-10) VAN [-2.8%]
M-B SPRINTER E6 (18- ) 3-SERIES VAN [1.2%]
FIAT DUCATO (02-04) VAN [-4.8%]
RENAULT MASTER E6 (16- ) dCi VAN [-2.8%]
FIAT DUCATO (02-07) VAN [-4.8%]
RENAULT MASTER E6 (16-) dCi WINDOW VAN [-2.8%]
FORD TRANSIT (00-06) T260 T280 T300 VAN [-3.8%]
RENAULT TRUCKS MASTER E6 (16- ) VAN [-2.8%]
FORD TRANSIT (00-06) T330 T350 T350EL VAN [-4.8%]
VAUXHALL MOVANO E6 (16- ) VAN [-2.8%]
FORD TRANSIT (01-06) PET VAN [-4.8%]
FORD TRANSIT (06-13) T350 - MESSING UNIT [-5.8%]
IVECO DAILY (06-09) 3.5t VAN [-1.8%]
IVECO DAILY (14-17) VAN [-1.8%]
IVECO DAILY (06-09) VAN [-1.8%]
M-B SPRINTER E6 (16- ) 2-SERIES VAN [1.2%]
IVECO DAILY (99-04) C CLASS VAN [-1.8%]
M-B SPRINTER E6 (16- ) 3-SERIES VAN [1.2%]
IVECO DAILY (99-05) S CLASS VAN [-1.8%]
PEUGEOT BOXER (14-16) VAN [1.2%]
IVECO DAILY (99-07) L CLASS VAN [-1.8%]
RENAULT MASTER (10-17) dCi VAN [-2.8%]
IVECO DAILY CNG (04-07) VAN [-1.8%]
RENAULT MASTER (14-16) dCi WINDOW VAN [-2.8%]
IVECO UNIJET DAILY (03-06) L CLASS VAN [-1.8%]
RENAULT TRUCKS MASTER (14-16) VAN [-2.8%]
IVECO UNIJET DAILY (03-07) C CLASS VAN [-1.8%]
VAUXHALL MOVANO (10-17) VAN [-2.8%]
IVECO UNIJET DAILY (03-07) S CLASS VAN [-1.8%]
FIAT DUCATO (06-14) VAN [-4.8%]
M-B SPRINTER (00-06) PET VAN [-8.8%]
FIAT DUCATO (06-14) WINDOW VAN [-4.8%]
M-B SPRINTER (00-06) VAN [-8.8%]
FORD TRANSIT (06-12) T250 - T350 PET VAN [-3.8%]
M-B SPRINTER (06-13) 2-SERIES VAN [-8.8%]
FORD TRANSIT (06-14) T250 - T300 VAN [-3.8%]
M-B SPRINTER (06-13) 3-SERIES VAN [-8.8%]
FORD TRANSIT (06-14) T330 - T350 VAN [-4.8%]
M-B SPRINTER (95-06) PET VAN [-8.8%]
IVECO DAILY (09-15) VAN [-1.8%]
RENAULT MASTER VI (98-04) VAN [-2.8%]
M-B SPRINTER (13- ) 2-SERIES VAN [-5.8%]
RENAULT TRUCKS MASTER (03-10) dCi VAN [-2.8%]
M-B SPRINTER (13- ) 3-SERIES VAN [-5.8%]
VAUXHALL MOVANO (99-04) VAN [-2.8%]
M-B SPRINTER CNG (09-13) SERIES-3 VAN [-8.8%]
CAPId
4x4 Pick-up Lifestyle SUV
Sector Share
%CAP
%CAP All Colours Condition Adjusted
35284
L200 DIESEL - Double Cab DI-D 178 Barbarian 4WD
7.04%
98.4%
98.4%
35282
L200 DIESEL - Double Cab DI-D 178 Warrior 4WD
5.15%
102.6%
102.6%
25079
AMAROK A32 DIESEL - D/Cab Pick Up Highline 2.0 BiTDI 180 BMT 4MTN Auto
4.31%
99.0%
100.2%
35006
RANGER DIESEL - Pick Up Double Cab Wildtrak 3.2 TDCi 200 Auto
4.10%
102.6%
101.5%
18622
L200 LWB LB DIESEL - Double Cab DI-D Barbarian 4WD 176Bhp
3.78%
102.3%
99.9%
19135
NAVARA DIESEL - Double Cab Pick Up Tekna 2.5dCi 190 4WD
3.57%
99.0%
98.8%
35285
L200 DIESEL - Double Cab DI-D 178 Barbarian 4WD Auto
3.05%
98.1%
99.5%
18623
L200 LWB LB DIESEL - Double Cab DI-D Barbarian 4WD Auto 176Bhp
2.94%
100.6%
101.9%
39511
NAVARA DIESEL - Double Cab Pick Up Tekna 2.3dCi 190 4WD Auto
1.89%
101.6%
101.6%
18672
L200 LWB LB DIESEL - D/Cab DI-D Warrior II 4WD 176Bhp [2010]
1.89%
104.2%
97.0%
The sector market share for Lifestyle Pick-ups last month remained much the same as January whilst overall price performance improved by just over 2%. Consequently many of the most popular models in this sector have had only a marginal downward price adjustment of just under 1% to allow for plate-age depreciation. However, there are a number of exceptions which are listed below.
We are still seeing a trade preference to pay only CAP Average prices for CAP Clean vehicles. Generally vehicles in this sector are difficult to sell unless they are in most desirable metallic colours and have canopies on the pick-up body. Late plate, relatively low mileage examples are still looking too expensive compared to new vehicle prices but, arguably, used sales of vehicles in this sector are not so much about price any more but indicative of waning retail demand.
FIAT FULLBACK (16- ) LIFE [-5.8%]
SSANGYONG KORANDO (13-16) [-2.8%]
GREAT WALL (12- ) [-4.8%]
SSANGYONG KORANDO SPORT (12-17) [-2.8%]
ISUZU D-MAX DIESEL (17- ) [-5.8%]
SSANGYONG MUSSO E6 (16- ) [-2.8%]
SSANGYONG KORANDO E6 (16- ) [-2.8%]
TOYOTA HILUX (10-16) D-4D LIFE [1.2%]
SSANGYONG KORANDO SPORT E6 (16-17) [-2.8%]
MITSUBISHI L200 (01-07) TD/TD 113 LIFE [-2.8%]
SSANGYONG MUSSO E6 (18- ) [-2.8%]
TOYOTA HILUX (01-10) PICK-UP LIFE [1.2%]
VAUXHALL VXR8 MALOO (16-18) [0%]
HGV MARKETPLACE
CAPId
4x4 Pick-up Workhorse
Sector Share
%CAP
%CAP All Colours Condition Adjusted
21665
HILUX DIESEL - HL2 D/Cab Pick Up 2.5 D-4D 4WD 144
15.33%
98.9%
98.9%
26500
NAVARA DIESEL - Double Cab Pick Up Visia 2.5dCi 144 4WD
8.00%
105.3%
103.8%
22413
RANGER DIESEL - Pick Up Double Cab XL 2.2 TDCi 150 4WD
6.67%
99.6%
101.9%
30784
HILUX DIESEL - Active D/Cab Pick Up 2.5 D-4D 4WD 144
5.33%
105.7%
105.7%
21676
DISCOVERY DIESEL - Commercial Sd V6 [255] Auto
4.67%
87.3%
91.1%
34428
DISCOVERY DIESEL - SE Commercial Sd V6 Auto
4.67%
103.0%
103.0%
18668
L200 LWB LB DIESEL - Double Cab DI-D 4Work 4WD 134Bhp [2010]
4.00%
114.1%
98.2%
21664
HILUX DIESEL - HL2 Extra Cab Pick Up 2.5 D-4D 4WD 144
4.00%
109.8%
106.4%
24963
D-MAX DIESEL - 2.5TD Double Cab 4x4
3.33%
101.6%
101.6%
21887
DEFENDER 90 SWB DIESEL - Hard Top TDCi [2.2]
2.67%
120.2%
106.0%
No change to report in the 4x4 Pick-up Workhorse sector last month as the number sold was on a par with January and overall sales performance was just over 100% of the average guide price. We have applied a downward price movement of just under 1% to most model ranges in this sector to allow for plate-age depreciation with the following notable exceptions which have had individual price adjustments.
The most significant downward price movements this month have been applied to Land Rover Freelander and Mitsubishi Outlander. Due to the relatively low number of these models we see in any current month we have had to look back further in our research data history. This highlighted clear weaknesses in price performance substantiating the relatively large downward price movements in this edition.
ISUZU D-MAX DIESEL (17- ) [1.2%]
TOYOTA HILUX (10-16) D-4D WORK [2.2%]
LAND ROVER (11-16) DEFENDER 90 110 130 TDCi [2.2%]
LAND ROVER (05-07) DEFENDER 110 Td5 [2.2%]
LAND ROVER DISCOVERY (18 - ) Euro 6 [-3.8%]
LAND ROVER (06-07) DEFENDER Td5 130 [2.2%]
LAND ROVER FREELANDER 2 (08-10) [-5.8%]
LAND ROVER DISCOVERY (07-09) [-3.8%]
MITSUBISHI OUTLANDER (07- ) WORK [-8.8%]
MITSUBISHI L200 (06-10) DI-D WORK [1.2%]
MITSUBISHI OUTLANDER (14- ) WORK HYBRID EV [-5.8%]
NISSAN NAVARA (13-16) PICK UP [2.2%]
NISSAN NAVARA E6 (16- ) PICK-UP [2.2%]
LAND ROVER (98-06) DEFENDER 110 Td5 [2.2%]
ISUZU D-MAX DIESEL (12-18) [1.2%]
LAND ROVER (98-07) DEFENDER 130 Td5 [2.2%]
LAND ROVER (07-11) DEFENDER 90 110 130 TDCi [2.2%]
LAND ROVER (98-07) DEFENDER 90 Td5 [7.2%]
LAND ROVER DISCOVERY (09- ) [-3.8%]
LAND ROVER DISCOVERY (93-05) Tdi Td5 [-3.8%]
LAND ROVER FREELANDER (99-05) PET [-5.8%]
MITSUBISHI L200 (01-04) TD/TD 113 WORK [1.2%]
LAND ROVER FREELANDER (99-07) [-5.8%]
MITSUBISHI L200 (04-07) TD/TD 113 WORK [1.2%]
MITSUBISHI L200 (10-16) DI-D WORK [1.2%]
NISSAN NAVARA (02-05) WORK [2.2%]
NISSAN NP300 NAVARA (16-16) PICK-UP [2.2%]
NISSAN NAVARA (05-08) WORK [2.2%]
Auction stocks have increased significantly recently due mainly to post Christmas de-fleets and the large number of ex Gulliver’s vehicles that are currently in the market. However, whilst stocks have increased actual on-the-day sales are only slightly higher than last month so if sales don’t start picking up quickly there will be so much stock around that storing it and presenting it for sale will become an increasing problem for the auctions.
In fact, storage is already starting to affect some auctions, who currently have full yards, with one auction currently utilising the customer car park as additional space. One auction recently had so much stock on sale that the run through sale became a static auction at 5pm when the drivers clocked off.
The number of Euro 6 tractor units available has increased considerably, primarily due to demise of the truck rental, contract hire and leasing company Gulliver’s. The majority of them are Mercedes-Benz Actros models and due to sheer quantity their values are beginning to fall but the wider issue is that they are dragging other manufacturer’s values down with them. As one buyer said in reference to the Mercedes-Benz units “why would you pay more for another make when these are getting cheaper?”
A representative of a major truck rental and contract hire company who was viewing a recent sale suggested that due to falling values of Euro 6 tractor units he was minded to return vehicles under buyback rather than retain them to sell.
Traders report that things are picking up nicely, one who specialises in Pet-Reg tractor units confirmed that business was pretty busy at the moment with several prospective orders in the pipeline. Most traders are reasonably positive and with so much stock available it is a buyers’ market at present for all but Euro 6 rigids which remain relatively scarce.
Retailers also report that they are currently pretty active and some good sales have been recorded, particularly so on late registered quality vehicles. Some retailer’s offering comprehensive warranties, refurbishment, conversions and long MOT’s continue to market vehicles which are attractive purchases.
Manufacturers continue to record good sales, especially those sales to end users and where additional incentives and warranties are included, increased revenues can be obtained. Some manufacturers continue to offer short term contract hire or lease deals on used vehicles in order to manage their stocks.
Records from our auction visits indicate that the average number of auction entries increased by over 32% last month but the number of on-the-day truck sales increased by only just over 2% in relation to total entries. Trailer sales decreased by almost 40% over the same period.
This is based on six auction visits and a total of 1266 viewed lots and as we always remind you these are ‘hammer sales’ on-the-day and converted provisional sales are not included. One auction reports that the conversion rates of provisional sales remains at around 60%.
This month’s research indicates that:
- 5t to 12t – Euro 6 values have fallen a little whilst pre Euro 6 values have remained steady with the exception of tippers where values have fallen slightly.
- 13t to 18t – Most values have remained stable although DAF LF’s have seen some derivative values increase slightly. Pre Euro 6 boxes and fridges have performed well whilst dropsides have struggled a little.
- Multi-wheel rigids – Values of most have remained steady although some tippers have seen a slight increase whilst some fridge values have dropped a little.
- Tractor units – Some 4x2 values have decreased slightly, particularly later models.
- Values of pre Euro 5 6x2 models have remained stable whilst Euro 5 values are a little bit of a mix with some seeing slight increases and some dropping a little.
- Euro 6 values are starting to fall across the board as reported earlier.
- Values of 6x4 and multi-axle tractor units have increased a little.
- Trailers – Most values have remained stable however values of boxes have fallen slightly and skeletal values have seen a slight increase in value.
7.5t to 12t Vehicles
Boxes and fridges remain plentiful especially so the former as many 62 12 plate DAF FA LF45.150’s from a contract hire company, off contract from a parcel delivery operator, have appeared and plenty similar stock is arriving at a steady pace. Other body types remain less numerous, so are more attractive to buyers.
Several 17 plate 12 tonne Euro 6 DAF LF180 boxes with sleeper cabs failed to reach reserve values so will doubtless re-appear at a subsequent sale. Similar LF210 day cabs on 64 14 plates have been around for a while now. High mileage and poor condition not aiding their plight.
A good selection of Euro 6 Mitsubishi Fuso Canter are available as boxes, curtains, fridges. Several 75C15 boxes on 16 plates with low kilometres and long MOT’s attracted good attention but as 180bhp models are more desirable not all sold on the day.
Plenty of 7.5t demount chassis cabs are available. 2012 and 2013 Iveco Eurocargo ML75E18’s from a furniture retailer and Isuzu Forward N75.190’s from a high street retailer all of which suffered mixed fortunes. Better examples are selling but the remainder are finding the going a little tougher and values are nothing to shout about.
Tippers are available on a variety of chassis but they are a little out of favour at present and values reflect this. The tipper market is seasonal and is expected to pick up as spring arrives.
13t to 18t Vehicles
2011 11 plate Scania P230 fridges have arrived in number from a high street retailer. The initial batch sold without too much trouble but further examples are beginning to struggle a little. However, they are tidy, have good specification and have manual gearboxes so they may find new homes reasonably soon.
Several tidy 2011 DAF FA LF55.220 day cab curtains with reasonable mileages have proved popular and tidy LF’s are generally selling well at the moment.
There are still a selection of 13 and 15 tonne fridges around, mainly DAF and Mercedes-Benz, but poor quality is preventing sales. 18t fridges remain numerous and those in poor condition are failing to achieve any real interest. Odd specification, undesirable fridge units, poor quality bodies and odd rear door configurations generally detract buyers from making meaningful offers.
Euro 6 values in this sector seemed to have settled a little after recent fluctuations. This may be due to the lack of stock at the moment and who knows what will happen as further vehicles arrive into the market? If premiums continue to be paid to secure a purchase, there may be further fluidity to come.
An unusual auction entry was a 64 14 plate Euro 6 14 tonne DAF LF210 day cab waste oil tanker, an unusual but well received auction entry, failed to attract sufficient attention to secure a sale.
Multi-wheelers
It remains the case that with the exception of hook loaders and tippers there are few examples of Euro 6 vehicles appearing in the open market. Most vehicles presented for sale are Euro 5 or older, some much older.
Plenty of 26 tonne dropsides with cranes are available but age and condition is against them and most are finding it difficult to secure new homes.
Clean and tidy refuse trucks from Gulliver’s continue to sell which seems to be aiding other similar aged vehicles, some of which have sold well recently.
A batch of 2013 63 plate sleeper cab DAF FAD CF85.410 tippers proved popular auction lots but most struggled to sell on the day. At the same sale a larger selection of 2012 62 plate sleeper cab Volvo FM 410 tippers from Cemex fared much better, all selling on the day, despite an additional 5% buyer’s fee.
Star of the show at one auction was a 2016 66 plate sleeper cab MAN TGS 18.400 eleven vehicle car transporter with 205,000 kilometres which sold for £90,000 after some competitive bidding.
Beavertails continue to appear in small numbers and continue to attract strong interest.
Tractor Units
The number of Euro 6 6x2 tractor units available have increased, particularly Mercedes-Benz Actros 2543 and Actros 2545 models, which were already readily available. One auction advertised a choice of 90 such vehicles available at one sale and with such volumes values are starting to fall as buyers become far more selective and it is likely that values will be under pressure for the foreseeable future.
An operator which usually sells directly tried a varied selection of late Euro 5 6x2’s and some similar Euro 6 vehicles in auction and whilst the majority sold there was an air of disappointment from the vendor at the values achieved, so it may be a while before we see them enter any further vehicles.
Euro 5 4x2 DAF FT CF75.310 day cab tractor units from a high street supermarket sold quickly when they appeared despite being aged between 2008 and 2010. The number of 4x2’s available has jumped recently and most are attracting good attention.
6x4 and multi-axle examples remain popular and values are seeing an increase. A low mileage 07 plate sleeper cab Iveco Trakker 410 6x4 carrying a Palfinger PK44002 crane provoked strong bidding and eventually sold for over £35,000.
Trailers
The trailer market continues to be reasonably steady although sales have slumped as often occurs post-Christmas.
Boxes are numerous but most examples are untidy leading to values falling slightly. Skeletals have performed better recently and their values have increase a little.
More tidy 2017 13.6m triaxle curtains again proved popular lots at auction but this time most failed to sell, possibly due to high reserve values. Tidy tri-axle flats with twist locks also attracted good interest as they appeared for sale.
The number of fridges available has increased and both 12.5 metre and 13.6 metre variants are available as well as some shorter ones. Supermarket specification fridges are currently readily available but having rear shutters and low internal height they are not the most desirable specification and therefore not the easiest equipment to sell.
Exporters are always on the lookout for fridges but their specification must exactly match their requirement if a sale is to occur.
As always it’s the specialist trailers that muster most attention and there was sufficient to whet the appetite last month as a variety of tippers, low loaders, machinery carriers and brick & block trailers with cranes being offered.

