
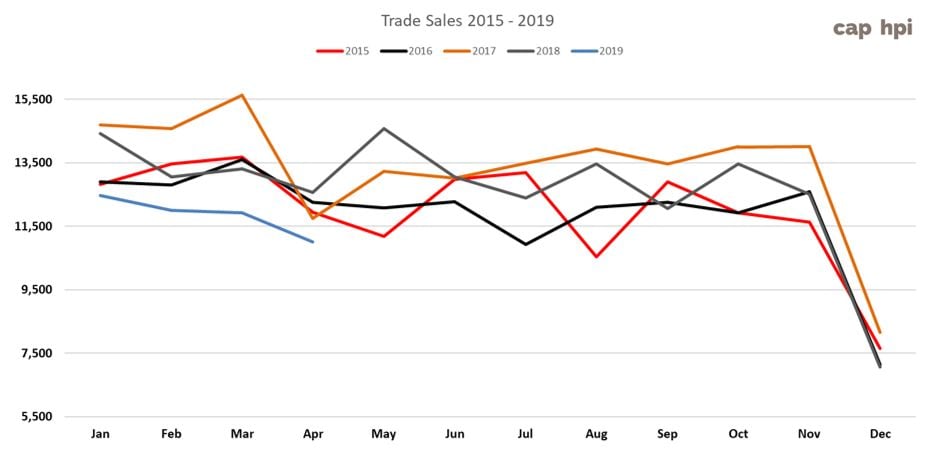
Sales volumes for May increased by around 11% as businesses returned back to normal following the April holidays, however, year on year sales seem set to remain significantly lower than the trends set in previous years. This is amidst reports from auction houses that sales conversion rates have fallen in recent weeks for some sectors, most noticeably Lifestyle 4x4 Pick-ups, and faint murmurings that retail sales are starting to falter.
Whilst this wasn’t immediately obvious from the auction sales we attended, we couldn’t help but notice that more vehicles were being sold provisionally and all too often bids were stopping well short of the guide values. Whilst this of course varied from sale to sale and from sector to sector, but one factor that stood out everywhere was the lack of interest in vehicles that were damaged or not properly prepared for sale.
It’s often said that professional trade buyers are not prepared to pay over the odds for poor quality vehicles, but from our observations at the auctions last month this maxim certainly rings true.
|
Jun-18 |
Jul-18 |
Aug-18 |
Sep-18 |
Oct-18 |
Nov-18 |
Dec-18 |
Jan-19 |
Feb-19 |
Mar-19 |
Apr-19 |
May-19 MTD |
|
|
Auction Entries % Var |
-3% |
0% |
2% |
-25% |
25% |
-7% |
-48% |
68% |
6% |
2% |
-8% |
16% |
|
Average age (Months) |
61 |
60 |
61 |
61 |
60 |
63 |
63 |
59 |
60 |
61 |
62 |
59 |
|
Average Mileage |
74,631 |
76,993 |
76,087 |
74,994 |
75,074 |
78,883 |
78,312 |
75,974 |
75,974 |
76,365 |
77,283 |
73,833 |
From a supply perspective, analysis of the main LCV sale catalogues reveals that May auction entries increased by around 15.5% when compared to the same period in April. The average age of vehicles decreased from 62 months to 59 months whilst the average recorded mileage decreased from 77,283 to 72,833 miles. Both of these metrics suggest a definite shift in the age/mileage profile which we would expect to see as more 3 year old vehicles enter the market due to the March spike in new LCV registrations. We must stress these are month to date figures and could vary slightly as the figures for the full month become available.
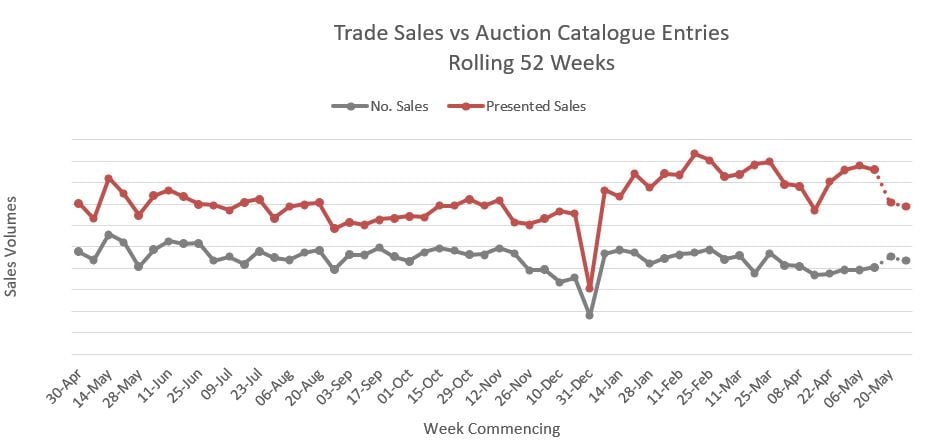
When we put weekly LCV auction sales against the weekly auction catalogue entries on the same chart it seems that the balance between supply and demand has returned to more sustainable levels. However, when we delve deeper into our research data the picture is less clear as some sectors are faring much better than others.
The following chart shows, at sector level, how the market has changed over the past month in terms of market share by sector, and, by sales performance against the guide values. The figures are based on 3 year old vehicles in a reasonable colour at 60K miles.
|
March 2019 |
April 2019 |
May 2019 |
||||
|
LCV Sector |
Market Share |
Performance |
Market Share |
Performance |
Market Share |
Performance |
|
City Van |
4.46% |
95.59% |
4.60% |
96.33% |
4.28% |
94.79% |
|
Small Van |
23.20% |
99.80% |
23.66% |
99.59% |
22.40% |
98.10% |
|
Medium Van |
30.63% |
99.71% |
29.81% |
100.56% |
31.31% |
99.51% |
|
Large Van |
18.98% |
98.06% |
17.58% |
97.32% |
17.40% |
97.28% |
|
Over 3.5T |
0.17% |
95.99% |
0.31% |
98.50% |
0.34% |
97.63% |
|
4x4 Pick-up Workhorse |
1.86% |
100.42% |
1.80% |
99.01% |
2.22% |
96.92% |
|
4x4 Pick-up Lifestyle SUV |
12.81% |
99.93% |
12.96% |
99.37% |
14.24% |
97.50% |
|
Forward Control Vehicle |
0.16% |
96.85% |
0.17% |
98.05% |
0.15% |
100.34% |
|
Chassis - Derived |
5.25% |
97.48% |
6.35% |
97.50% |
4.61% |
97.56% |
|
Mini-bus |
0.36% |
104.36% |
0.34% |
103.45% |
0.54% |
101.16% |
|
Vat Qualifying |
1.77% |
100.27% |
2.03% |
100.89% |
2.36% |
100.22% |
|
Total Market |
100.00% |
99.18% |
100.00% |
99.22% |
100.00% |
98.20% |
The City Van sector continues to under-perform largely down to a large de-fleet of blue Ford Fiesta vans. However when we removed those vehicles from our analysis the sector remained around 4% behind the guide.
Prices have continued to weaken in the Large Van and over 3.5 tonnes sector which has led to some significant adjustments being made to the guide prices in this edition.
Whilst 4x4 Lifestyle pick-ups rank only fourth in terms of sector market share, on average, they include some of the highest value vehicles entered for sale at LCV auctions. As mentioned in previous editions, only vehicles in the best condition with non-standard extras, such as load covers or hard tops are, getting anywhere near CAP Clean prices which is effectively less than their true worth because of the added value of the extras. Standard vehicles without any extras, exhibiting more than the most minor cosmetic defects are either selling for less than ‘CAP Below’ prices or failing to sell at all.
A little under two months since the introduction of the world’s toughest vehicle emissions standard, according to reports from Transport for London (TFL), there are still around 17,400 non-compliant vehicles a day entering the Ultra-Low Emissions Zone generating a staggering £218K a day in charges. Whilst so far TFL haven’t published a break-down of vehicle types it is fair to assume that a significant proportion of that revenue will come from both light and heavy commercial vehicles.
There has long been speculation in the industry that the cumulative costs of operating a non-compliant vehicles in the ULEZ will force a mass exodus of non-compliant vehicles from the south to be replaced by a corresponding mass arrival of compliant Euro 6 models. A similar situation occurred when the Euro 5 emissions standards were implemented in 2009 and for a while there was a glut of non-compliant vehicles that had to eventually find homes.
Whilst it’s still early days, according to our research during May, there was little if any evidence to suggest that buyers were showing any preference for Euro 6 models over Euro 5s. Clearly availability of used stock is going to be a major factor, for example, looking at the combined total of Euro 5 and Euro 6 sales in the Medium Van sector, only 25% were Euro 6 models. Interestingly in this sector Euro 5 models sold for 1.7% more than Euro 6 models. However in the Large Van sector, Euro 6 models took only 23% of the combined sales but on average they sold for 1.7% more.
Average Guide Price Changes by Sector
cap hpi’s LCV editors have been analysing the registrations of new LCV and wholesale used LCVs, over a number of years, to examine the trend of vehicle production and sales volumes in terms of colour.
Traditionally, the majority of LCVs would have been white. With the diversification of LCV customers, usage and model types, in 2019, only 52.22% of new LCV registrations in the UK were white.
A similar trend can be seen in the used market. In 2019 54.4% of the wholesale LCV volume were apportioned to white vehicles, a drop of over 4% since 2016.
This trend, and customer feedback, has guided the LCV editorial team to now generate valuation data and insight based on all reasonable LCV colours, rather than purely for white vehicles. Now 100% of the data received on used LCVs will be included in future valuation analysis.
This will be beneficial, as now:
- There will be no need to adjust the purchase or sales price of an LCV as long as the vehicle is of a reasonable colour.
- More valuation data points will be taken into consideration when cap hpi analyses used LCV prices.
A reasonable colour is defined as the top 10 new LCV registrations by colour; white, grey, silver, black, blue, red, green, orange, yellow and brown.
There will remain differences in what may be paid for colours in the used LCV market but this is deemed to be down to specific customer choice rather than certain colours broadly achieving lower amounts.
The average percentage and monetary movements in the table below gives indication of the price adjustments we’ve made to models in each sector for the June edition of the guide. These are based on vehicles in a reasonable colour at 3years / 60k miles.
|
April 2019 |
May 2019 |
June 2019 |
||||
|
LCV Sector |
Average % Movement |
Average £ Movement |
Average % Movement |
Average £ Movement |
Average % Movement |
Average £ Movement |
|
City Van |
-2.9% |
-£103 |
-1.9% |
-£75 |
-0.8% |
-£30 |
|
Small Van |
-1.3% |
-£64 |
-1.5% |
-£76 |
-1.4% |
-£69 |
|
Medium Van |
0.3% |
£28 |
-1.0% |
-£102 |
-0.9% |
-£89 |
|
Large Van |
-3.7% |
-£313 |
-1.3% |
-£113 |
-2.3% |
-£200 |
|
Over 3.5T |
-1.8% |
-£192 |
-1.0% |
-£120 |
-1.5% |
-£182 |
|
4x4 Pick-up Workhorse |
1.6% |
£193 |
-1.1% |
-£130 |
-0.7% |
-£79 |
|
4x4 Pick-up Lifestyle SUV |
-0.6% |
-£70 |
-1.9% |
-£226 |
-1.7% |
-£197 |
|
Forward Control Vehicle |
-0.8% |
-£91 |
-1.0% |
-£116 |
-0.9% |
-£100 |
|
Chassis - Derived |
-2.5% |
-£234 |
-1.1% |
-£111 |
-1.4% |
-£136 |
|
Mini-bus |
2.1% |
£248 |
0.3% |
£36 |
-0.8% |
-£108 |
|
Vat Qualifying |
-0.8% |
-£98 |
-5.2% |
-£620 |
1.4% |
£173 |
Top 10 models driving the used LCV Market
The Top 10 tables below give you a clear picture of the makes and models in the main LCV sectors that are driving prices in the used LCV Market. Arranged in order of their respective share of total sector sales, the percentage CAP performance is based on actual recorded sales at open auctions.
Since our guide values reflect the market prices of basic vans in a reasonable colour as they appear in the vehicle manufacturer’s price lists, some of the guide price movements you might see in this edition may not correlate directly with the sales performances shown in the tables. Also, as part of the process for reviewing guide prices, we take into account condition and the weighting effect that stock availability and sales volume might have on prices.
The commentary contained within the Top 10 Tables is intended to give an overview of any sector level price adjustments we have made in this edition along with specific items of interest that we noted whilst attending auctions and analysing our sales research data.
We also include an exception list of model ranges which have had individual price adjustments rather than sector-level. The percentage value in brackets at the end of each of the model range names listed in the table indicates any individual price change we’ve made in this edition.
|
CAPId |
City Van |
Sector Share |
%CAP |
%CAP Condition Adjusted |
||
|
26326 |
FIESTA DIESEL - 1.6 TDCi ECOnetic Van |
19.31% |
77.4% |
95.6% |
||
|
26324 |
FIESTA DIESEL - 1.5 TDCi Van |
6.85% |
97.4% |
96.7% |
||
|
30869 |
TRANSIT COURIER DIESEL - 1.5 TDCi Van |
4.67% |
93.9% |
94.8% |
||
|
24216 |
NEMO DIESEL - 1.3 HDi LX [non Start/Stop] |
4.67% |
100.0% |
96.9% |
||
|
24217 |
NEMO DIESEL - 1.3 HDi Enterprise [non Start/Stop] |
4.36% |
95.8% |
96.5% |
||
|
24231 |
BIPPER DIESEL - 1.3 HDi 75 S Plus Pack [SLD] [non Start/Stop] |
4.05% |
100.8% |
103.0% |
||
|
20490 |
FIESTA DIESEL - 1.6 TDCi 95 DPF ECOnetic Van |
3.74% |
69.1% |
90.7% |
||
|
15141 |
BIPPER DIESEL - 1.4 HDi 70 S [SLD] |
3.43% |
93.8% |
100.4% |
||
|
21678 |
ASTRAVAN DIESEL - Club 1.7 CDTi ecoFLEX Van |
3.12% |
87.9% |
102.4% |
||
|
20844 |
CORSAVAN DIESEL - 1.3 CDTi 16V ecoFLEX Van |
2.49% |
90.0% |
97.2% |
||
|
Sales of City Vans increased by almost 13% whilst prices fell by just over 5% to 94.79%. As we reported last month most of this under-performance can be attributed to a large de-fleet of Ford Fiesta 1.6 TDCi ECOnetic Vans. They accounted for over 37% of total sales in this sector with many of them selling on average for around 80% of the guide values. A downward price movement of 1% has been applied to most model ranges in this sector with the following exceptions.
|
||||||
CAPId
Small Van
Sector Share
%CAP
%CAP Condition Adjusted
18445
BERLINGO L1 DIESEL - 1.6 HDi 625Kg Enterprise 75ps
10.16%
99.9%
100.6%
11465
COMBO DIESEL - 2000 1.3CDTi 16V Van [75PS]
3.49%
106.6%
99.5%
34468
PARTNER L1 DIESEL - 850 1.6 HDi 92 Professional Van
3.30%
96.0%
95.6%
26689
TRANSIT CONNECT 200 L1 DIESEL - 1.6 TDCi 115ps Limited Van
2.26%
103.2%
98.6%
38471
BERLINGO L1 DIESEL - 1.6 BlueHDi 625Kg Enterprise 75ps
2.07%
95.6%
100.1%
15182
BERLINGO L1 DIESEL - 1.6 HDi 625Kg LX 75ps
2.01%
89.6%
100.7%
24235
COMBO L1 DIESEL - 2000 1.3 CDTI 16V ecoFLEX H1 Van
2.01%
89.0%
94.8%
28276
CADDY MAXI C20 DIESEL - 1.6 TDI 102PS Startline Van
1.94%
88.9%
91.1%
28277
CADDY MAXI C20 DIESEL - 1.6 TDI BlueMotion Tech 102PS Startline Van
1.88%
98.1%
99.2%
28266
CADDY C20 DIESEL - 1.6 TDI 102PS Startline Van
1.75%
99.0%
96.0%
The number of Small Vans sold last month increased by 2.1% whilst the average price performance against the guide fell by just under 2% to 98.10%. Most this was down to poor performance of older models whilst prices of later models held firm. A downward price movement of 1% has been applied to most model ranges in this sector to take into account plate-age depreciation with the following notable exceptions…
M-B CITAN (49 2.1%13- ) VAN (2%)
VAUXHALL COMBO (12-18) VAN (-4%)
RENAULT KANGOO (13-17) VAN (0%)
RENAULT KANGOO (02-09) VAN (1%)
VAUXHALL COMBO E6 (16-19) VAN (0%)
VW CADDY (04-10) C20 VAN (-6%)
RENAULT KANGOO (08-13) VAN (1%)
VW CADDY (96-04) FRIDGE (-6%)
RENAULT KANGOO COMPACT (08-10) PET VAN (1%)
VW CADDY (96-04) VAN (-6%)
RENAULT KANGOO COMPACT (08-10) VAN (1%)
CAPId
Medium Van
Sector Share
%CAP
%CAP Condition Adjusted
25441
TRANSIT CUSTOM 270 L1 DIESEL FWD - 2.2 TDCi 125ps Low Roof Limited Van
3.52%
95.9%
99.1%
25437
TRANSIT CUSTOM 270 L1 DIESEL FWD - 2.2 TDCi 100ps Low Roof Van
2.22%
97.1%
96.7%
26570
TRANSIT CUSTOM 270 L1 DIESEL FWD - 2.2 TDCi 100ps Low Roof Van ECOnetic
2.03%
100.2%
100.7%
28447
TRANSPORTER T32 SWB DIESEL - 2.0 TDI 140PS Startline Van
2.03%
106.2%
106.2%
18442
DISPATCH L1 DIESEL - 1000 1.6 HDi 90 H1 Van Enterprise
2.03%
95.0%
96.7%
25446
TRANSIT CUSTOM 290 L1 DIESEL FWD - 2.2 TDCi 100ps Low Roof Van
1.98%
100.7%
101.6%
25471
TRANSIT CUSTOM 290 L2 DIESEL FWD - 2.2 TDCi 100ps Low Roof Van
1.88%
95.3%
96.0%
25475
TRANSIT CUSTOM 290 L2 DIESEL FWD - 2.2 TDCi 125ps Low Roof Limited Van
1.64%
97.8%
96.9%
31732
VIVARO L2 DIESEL - 2900 1.6CDTI BiTurbo 120PS ecoFLEX Sportive H1 Van
1.54%
96.5%
94.0%
34624
TRANSPORTER T28 SWB DIESEL - 2.0 TDI BMT 102 Trendline Van Euro 6
1.45%
98.0%
96.5%
Sales of vans in the Medium Van sector were up by 15% last month with prices holding firm at 99.51% of the guide. Ford Transit Custom continues to dominate this sector taking 6 of the Top 10 sales volume rankings and according to our research, they accounted for 38% of all used vehicles sold in this sector. With so much choice available it’s perhaps not surprising that buyers have the upper hand and prices have fallen slightly for the most popular models.
A downward price movement of 1% has been applied to most models in this sector in order to reflect plate-age depreciation, with the following exceptions listed below.
TOYOTA PROACE (12-16) VAN (-3%)
VAUXHALL VIVARO (02-06) PET VAN (-2%)
RENAULT TRAFIC (06-14) dCi VAN (-2%)
VAUXHALL VIVARO (06-11) VAN (-3%)
VAUXHALL VIVARO (01-07) VAN (-2%)
CAPId
Large Van
Sector Share
%CAP
%CAP
Condition Adjusted
26863
SPRINTER 313CDI LONG DIESEL - 3.5t High Roof Van
4.59%
92.0%
94.4%
31707
BOXER 335 L3 DIESEL - 2.2 HDi H2 Professional Van 130ps
2.91%
94.1%
100.8%
31217
RELAY 35 L3 DIESEL - 2.2 HDi H2 Van 130ps Enterprise
2.75%
94.2%
97.9%
36948
SPRINTER 314CDI LONG DIESEL - 3.5t High Roof Van
2.52%
95.5%
94.2%
30637
TRANSIT 350 L3 DIESEL RWD - 2.2 TDCi 125ps H3 Van
2.45%
94.5%
98.8%
21705
CRAFTER CR35 LWB DIESEL - 2.0 TDI 136PS High Roof Van
2.22%
96.4%
96.8%
38198
BOXER 335 L3 DIESEL - 2.0 BlueHDi H2 Professional Van 130ps
2.14%
97.3%
98.1%
18656
MASTER LWB DIESEL FWD - LM35dCi 100 Medium Roof Van
2.06%
126.7%
96.5%
9104
TRANSIT 260 SWB DIESEL FWD - Low Roof Van TDCi 85ps
1.91%
93.7%
105.4%
30618
TRANSIT 350 L3 DIESEL FWD - 2.2 TDCi 100ps H2 Van
1.68%
98.6%
99.6%
Whilst around 15% more vans were sold in the Large Van sector during May, the sector market share was marginally lower than the previous month and prices weakened again at 97.28%. A downward price movement of 1% has been applied to most model ranges in this sector, however, there are significant number of exceptions which are worth noting…
FIAT DUCATO (14- ) VAN (-2%)
M-B SPRINTER (13- ) 3-SERIES VAN (-3%)
IVECO DAILY E6 (14- ) VAN (-3%)
M-B SPRINTER CNG (09-13) SERIES-3 VAN (-4%)
NISSAN NV400 E6 (16- ) VAN (0%)
PEUGEOT BOXER (06-14) VAN (-2%)
VW CRAFTER (17- ) VAN (-2%)
VW CRAFTER (06-17) VAN (-2%)
CITROEN RELAY (14-16) VAN (-3%)
IVECO DAILY (06-09) 3.5t VAN (-3%)
IVECO DAILY (14-17) VAN (-3%)
IVECO DAILY (06-09) VAN (-3%)
M-B SPRINTER E6 (16- ) 2-SERIES VAN (-3%)
IVECO DAILY (99-04) C CLASS VAN (-3%)
M-B SPRINTER E6 (16- ) 3-SERIES VAN (-3%)
IVECO DAILY (99-05) S CLASS VAN (-3%)
NISSAN NV400 (11- ) VAN (0%)
IVECO DAILY (99-07) L CLASS VAN (-3%)
RENAULT MASTER (10-17) dCi VAN (-2%)
IVECO DAILY CNG (04-07) VAN (-3%)
VAUXHALL MOVANO (10-17) VAN (-4%)
IVECO UNIJET DAILY (03-06) L CLASS VAN (-3%)
VW CRAFTER E6 (16-17) VAN (-2%)
IVECO UNIJET DAILY (03-07) C CLASS VAN (-3%)
CITROEN RELAY (06-14) VAN (-5%)
IVECO UNIJET DAILY (03-07) S CLASS VAN (-3%)
FORD TRANSIT (06-12) T250 - T350 PET VAN (-2%)
M-B SPRINTER (00-06) PET VAN (-4%)
FORD TRANSIT (06-14) T250 - T300 VAN (-5%)
M-B SPRINTER (00-06) VAN (-4%)
FORD TRANSIT (06-14) T330 - T350 VAN (-2%)
M-B SPRINTER (06-13) 2-SERIES VAN (-4%)
IVECO DAILY (09-15) VAN (-3%)
M-B SPRINTER (06-13) 3-SERIES VAN (-4%)
M-B SPRINTER (13- ) 2-SERIES VAN (-3%)
M-B SPRINTER (95-06) PET VAN (-4%)
CAPId
4x4 Pick-up Lifestyle SUV
Sector Share
%CAP
%CAP Condition Adjusted
25079
AMAROK A32 DIESEL - D/Cab Pick Up Highline 2.0 BiTDI 180 BMT 4MTN Auto
5.19%
90.1%
94.4%
21668
HILUX DIESEL - Invincible D/Cab Pick Up 3.0 D-4D 4WD 171
5.19%
93.1%
93.7%
35282
L200 DIESEL - Double Cab DI-D 178 Warrior 4WD
4.67%
95.3%
95.2%
35285
L200 DIESEL - Double Cab DI-D 178 Barbarian 4WD Auto
4.05%
96.5%
97.1%
35006
RANGER DIESEL - Pick Up Double Cab Wildtrak 3.2 TDCi 200 Auto
3.42%
99.0%
98.1%
35284
L200 DIESEL - Double Cab DI-D 178 Barbarian 4WD
3.22%
99.0%
98.2%
38361
HILUX DIESEL - Invincible D/Cab Pick Up 2.4 D-4D
3.22%
103.9%
102.6%
39511
NAVARA DIESEL - Double Cab Pick Up Tekna 2.3dCi 190 4WD Auto
2.59%
98.5%
95.2%
18623
L200 LWB LB DIESEL - Double Cab DI-D Barbarian 4WD Auto 176Bhp
2.59%
98.6%
100.9%
22415
RANGER DIESEL - Pick Up Double Cab Limited 2.2 TDCi 150 4WD
2.49%
96.5%
96.5%
Lifestyle Pick-ups accounted for 14.24% of all LCVs sold last month which is almost a 17% increase on last month. However, the average performance was down at 97.5% which is a significant amount when you consider the average age mix and relatively high prices of vehicles in this sector.
It is worth noting that the guide values we publish in all sectors are for vehicles as they appear in the vehicle manufacturer’s price list and do not include any manufacturer’s optional extras or third party extras. This is particularly relevant point for vehicles in this sector because many of the vehicles seen at auction have extras fitted to them including lockable load covers or hardtops over the pick-up body which are highly desirable to retail buyers.
The guide prices for most model ranges have gone down by 1% in this edition with the following exceptions…
GREAT WALL (12- ) (-6%)
ISUZU D-MAX DIESEL (12-18) (-4%)
MITSUBISHI L200 (15- ) DI-D LIFE (-4%)
ISUZU RODEO (07-12) LIFE (-2%)
VW AMAROK (16- ) LIFE (0%)
MITSUBISHI L200 (01-07) TD/TD 113 LIFE (-4%)
HGV MARKETPLACE
CAPId
4x4 Pick-up Workhorse
Sector Share
%CAP
%CAP Condition Adjusted
21665
HILUX DIESEL - HL2 D/Cab Pick Up 2.5 D-4D 4WD 144
11.11%
90.1%
93.6%
22413
RANGER DIESEL - Pick Up Double Cab XL 2.2 TDCi 150 4WD
10.37%
101.4%
96.5%
16571
RANGER DIESEL - Pick Up Double Cab XL 2.5 TDCi 4WD
7.41%
90.9%
92.8%
21676
DISCOVERY DIESEL - Commercial Sd V6 [255] Auto
4.44%
93.2%
93.2%
34999
RANGER DIESEL - Pick Up Double Cab XL 2.2 TDCi
3.70%
105.4%
105.4%
24963
D-MAX DIESEL - 2.5TD Double Cab 4x4
3.70%
88.1%
88.1%
26500
NAVARA DIESEL - Double Cab Pick Up Visia 2.5dCi 144 4WD
3.70%
95.0%
95.0%
30782
HILUX DIESEL - Active Pick Up 2.5 D-4D 4WD 144
3.70%
114.3%
111.4%
29907
DISCOVERY DIESEL - XS Commercial Sd V6 Auto
2.96%
96.7%
96.7%
30784
HILUX DIESEL - Active D/Cab Pick Up 2.5 D-4D 4WD 144
2.96%
100.8%
100.8%
Whilst sales were up by around 29% last month, overall prices weakened by just over 3%. Under-performance of old shape Ford Rangers, LR Discovery and Isuzu D-Max (14-18) were the main cause whilst prices held firm for most other models. We have applied a downward price movement of just under 1% to all model ranges in this sector to allow for plate-age depreciation with the followings exceptions.
MITSUBISHI SHOGUN (14-18) (2%)
FORD RANGER (02-06) PICK-UP WORK (-3%)
FORD RANGER (15-19) CHASSIS PICK-UP WORK (0%)
FORD RANGER (05-06) CHASSIS (-3%)
ISUZU D-MAX DIESEL (12-18) (-5%)
FORD RANGER (06-09) CHASSIS (-3%)
LAND ROVER (07-11) DEFENDER 90 110 130 TDCi (0%)
FORD RANGER (06-09) PICK-UP WORK (-3%)
LAND ROVER DISCOVERY (09- ) (-5%)
FORD RANGER (06-09) TIP (-3%)
MITSUBISHI SHOGUN (00-16) (2%)
FORD RANGER (09-11) CHASSIS (-3%)
FORD RANGER (11-16) CHASSIS WORK (-3%)
FORD RANGER (09-11) PICK-UP WORK (-3%)
FORD RANGER (11-16) PICK-UP WORK (-3%)
FORD RANGER (09-11) TIP (-3%)
LAND ROVER DISCOVERY (07-09) (-5%)
LAND ROVER (98-07) DEFENDER 90 Td5 (0%)
Auction attendances have remained pretty consistent recently, with the exception of the bank holiday weeks when traditionally buyers are often much lighter in number. The average number of auction entries continued to increase last month but hammer sales have again decreased. With such a large and growing volume of vehicles available it is starting to put pressure on values as buyers have such a wide choice to purchase from.
Manheim’s decision to re-enter the HGV physical sale market has been received favourably by buyers and it may assist sellers too as it offers another avenue to market. It may also help hasten sales and reduce current high volumes which can only be a good thing because if numbers decrease it may eventually help values.
Manheim’s HGV operation is based at Bruntingthorpe and it started at the end of May with a launch sale offering of around 120 entries from several vendors.
Dealers report that things have gone a little quiet recently and prospective buyers are being more cautious with their money with some awaiting clarification on local clean air zones before committing to buy.
It is expected that Euro 5 vehicles will continue to sell, but in diminishing numbers, during the coming months as we approach the implementation of further new zones next year. The market is expected to quickly swing towards Euro 6 and Euro 5 will eventually find the home market an increasingly difficult arena.
At the moment pre Euro 6 vehicles are already finding difficulty in attracting buyers from abroad. Export is currently slow and increasing shipping costs are not helping. Vehicles that were once the staple diet for export in recent years, such as quality older vehicles and manual gearbox tractor units, are declining in number.
Manufacturers continue to record good sales, particularly those to end users, where additional incentives and warranties are often included. There can often be a substantial difference in price for end user sales and those sold into the trade. Some manufacturers continue to offer short term contract hire or lease deals on used vehicles in an effort to efficiently manage stock and mitigate risk.
Retailers are also currently seeing reasonable sales performances especially so for rigid vehicles. Some retailer’s offer comprehensive refurbishment, conversions, long MOT’s and good warranties to add value, making their vehicles attractive propositions
Records from our auction visits indicate that the average number of auction entries rose again last month by over 7%. However, the number of on-the-day truck sales decreased by just over 7% in relation to total entries but trailer increased by over 12% during the same period.
This is based on nine auction visits and a total of 1975 viewed lots and as we always remind you these are ‘hammer sales’ on-the-day and converted provisional sales are not included. One auction reports that the conversion rates of provisional sales remains at around 50%.
This month’s research indicates that:
- 5t to 12t – Pre Euro 6 values have fallen and depending on manufacturer and body type some Euro 6 values have seen either a slight increase or decrease in value, although many values have remained steady.
- 13t to 18t – Just like the 7.5t-12t sector pre Euro 6 values have suffered and Euro 6 values have performed similarly to their smaller cousins.
- Multi-wheel rigids – Pre Euro 6 values have decreased a little and whilst most Euro 6 values have remained stable, tippers and skip-loaders have seen a slight lift in values.
- Tractor units – With just a few exceptions little has changed for 4x2 models. Pre Euro 6 6x2 values have generally fallen and some Euro 6 values have done likewise although many have remained steady.
- Trailers – Values for most types have fallen a little although, platforms, skeletals and fridges have performed sufficiently to maintain or increase value
7.5t to 12t Vehicles
There is no let up on the number of 7.5t vehicles available, with boxes and fridges being in plentiful supply at present. Dependent on specification some are finding new homes but with so many to choose from buyers are being selective with their purchases and many are struggling to find willing buyers.
There are plenty of six year old Iveco Eurocargo boxes with lots of similar aged vehicles from other manufacturers being readily available. Buyers are even shunning higher mileage Euro 6 examples prepared to wait until lower mileage examples appear.
Tippers, are popular at present but this is to be expected at this time of year and it follows a period where plenty have been available but even older ones are now trickling out of the door. Late curtains and dropsides are fewer in number and generally sell well when they appear.
Beavertails and other specialist vehicles always attract attention and subject to condition usually sell with ease.
A couple of odd vehicles seen at auctions were a pair of 2015 65 plate 9 tonne Mitsubishi Fuso Canter 9C18 boxes with around 280,000 kilometres neither of which attracted any real interest.
7.5 tonne hook loaders are rare so when one appeared for sale recently good interest was forthcoming. It was a DAF FA LF45.160 on a 57 2007 plate but with only 180,000 warranted kilometres it proved a popular lot and it sold for £7,200.
13t to 18t Vehicles
Boxes, curtains, fridges and even dropsides have met varying degrees of enthusiasm as they appeared but anything non-standard attracted additional interest. The large number of available vehicles means that poorly presented examples are generally being overlooked and usually appear at several subsequent auctions.
Euro 6 examples in this sector generally continue to prosper and for the moment at least values for most remain relatively stable. Certain manufacturers and body types which are considered desirable have actually seen values increase a little.
A selection of tidy beavertails and skip loaders provoked good interest recently, the insufficient supply of such vehicles in good condition helped most to find new homes. One skip loader which easily sold was a 2014 64 plate MAN TGM 18.250 with Hyva lift equipment. Such new examples are rare and the fact it was tidy and Euro 6 helped it fly.
A number of orange DAF FA LF55.180 13t bread van boxes from a well-known bakery, predominantly over ten years old are struggling in the auction. Newer DAF LF boxes at 14t and 15t fared better but values are beginning to suffer.
Multi-wheelers
There has been a general decrease in values of pre Euro 6 vehicles in this sector whilst Euro 6 hook-loaders and tippers remain popular, especially 8x4’s fitted with cranes and grabs and values for some have seen a slight increase.
Very few Euro 6 examples of other variants in the open market remain scarce and those seen have performed well.
Refuse trucks are provoking little interest, any interest noted has been for later registered vehicles with the best specification.
Fridges on various chassis continue to be available but as always it is age and condition that determines the interest shown.
Beavertails, especially with cranes always muster good interest. A couple of Euro 5 DAF’s from a well-known plant hire company did exactly that and sold particularly well.
Another example which provoked strong bidding was a clean and tidy 2010 60 plate DAF FTG CF 85.460 Space cab drawbar capable beavertail which possibly started life as a tractor unit. In 2014 it received a new Fassi F455 crane and it’s new body. It obtained a bid of £57,500.
Tractor Units
As more Euro 6 6x2 mid-lift examples continue to appear values are starting to suffer as a result of which pre Euro 6 values are in decline as well. There are always exceptions and the Euro 5 Mercedes-Benz Axor defies the trend and is currently prospering with increasing values.
The number of Mercedes-Benz Actros on the auction circuit has significantly decreased recently which may help their values which have been in decline for some time.
The best interest remains for high specification vehicles with all the driver comforts, but even these can struggle on the day.
6x4 and other multi-axle variants continue to be strong sellers. One example recently seen was a 13 plate Scania R620 V8 Topline 8x4 example to STGO CAT 3 standard, (150 tonnes), which generated a bid of £71,500. However at a subsequent sale it reached only £64,000.
With tractor units being less likely to be affected HGV clean air zones being as they are less likely to deliver into the zones than rigids means that Euro 5 examples should endure a lengthier future life in comparison to Euro 5 rigids.
Trailers
Sales have increased a little recently and whilst most values have fallen a little there remains good interest and tidy examples which continue to find buyers.
Triaxle extendable skeletals remain few in number and have sold well as they appear and values have increased a little. The same can be said for tidy tippers, whereas tidy fridges and platforms remain popular and garner good interest as they appear and their values remain steady
Triaxle curtains remain plentiful but the good examples continue to find buyers, however anything untidy and needing remedial work are unlikely to find buyers very quickly.

