
In a single word, resilient seems to sum up the LCV market last month and for the whole of 2017 for that matter. Despite all the doom and gloom we are fed on a daily basis by the media, the continuing economic and political turmoil, austerity and the nation’s bewilderment over Brexit, the used LCV market just seems to keep on going regardless. Judging from the auctions we attended around the country last month it was business as usual with professional buyers out in force and in buying mode. It’s been a similar story for most of the year marred only by occasional stock shortages/model mix issues. In recent months though the stock issues have eased considerably.
Analysis of the auction sale catalogues revealed that auction entries for November were up by 5% compared to October whilst the average age of vehicles remained the same at 61 months (MTD). The average recorded mileage increased slightly from 74,606 to 76,195 (MTD); to put that in perspective, this time last year the average age of vehicles was 63 months whilst the average mileage was pretty much the same at 76,041 miles.
|
Forecast |
||||||||||||
|
Dec-16 |
Jan-17 |
Feb-17 |
Mar-17 |
Apr-17 |
May-17 |
Jun-17 |
Jul-17 |
Aug-17 |
Sep-17 |
Oct-17 |
Nov- |
|
|
Auction Entries |
|
17872 |
17997 |
19694 |
15361 |
16433 |
15310 |
15054 |
15368 |
13031 |
14564 |
15292 |
|
Auction Entries % Var |
-42% |
72% |
0% |
9% |
-28% |
7% |
-2% |
4.50% |
-2% |
-25% |
19% |
5% |
|
Average age (Months) |
63 |
60 |
59 |
60 |
62 |
59 |
59 |
57 |
61 |
59 |
60 |
61 |
|
Average Mileage |
77217 |
75619 |
74127 |
73214 |
74310 |
72879 |
72264 |
74050 |
73821 |
72201 |
73283 |
76,195 |
Whilst the increasing volume seen over the past two months has surely been welcomed by trade buyers, as we head towards the end of 2017, it is abundantly clear that we have seen nowhere near the potential number of used LCVs returning to the open wholesale market that the historic new LCV registration figures suggest.
Looking at the whole of 2016 the most popular plate seen at auction was the March 2013, 13 plate which on its own accounted for 8.93% of all entries; 2013 registered vehicles in general accounted for 16.44%.
|
Year |
New LCV Registrations |
YOY Change |
% Change |
|
2012 |
239,641 |
|
|
|
2013 |
271,073 |
31,432 |
13.12% |
|
2014 |
321,686 |
50613 |
18.67% |
|
2015 |
371,830 |
50144 |
15.58% |
Based on what we saw in 2016 it is therefore reasonable to assume that vehicles first registered in 2014 (or 3 year old vehicles) were likely to be the most popular vehicles seen at auction in 2017. According to the SMMT’s New LCV Registration figures, potentially, there ought to have been around 18.67% more 2014 (3 year old) registered vehicles entering the used LCV wholesale market than the 2013 registered vehicles we saw in 2016.
According to the research evidence we’ve gathered throughout 2017 there has only been a 10.1% increase in 2014 registered (3 year old) vehicles entering the used market. That’s around 4,500 vehicles less than expected.
Quite clearly something has changed. One suggestion is that contract hire and leasing companies may be turning to other remarketing routes for some of their vehicles coming off contract, particularly those in the best condition. Another suggestion is that operators who have lived through a global recession and forced into running vehicles for extended periods, have realised it wasn’t so bad after all. Vehicles in general are more reliable than they have ever been and remain as economical to operate well beyond the traditional 3 year 60K leasing model. The falling new LCV registration figures tends to support this view, or, arguably, it’s all simply a reflection of uncertainty in the UK economy and the downturn in GDP.
In reality it’s probably all of these factors but the main issues for the used market are the supply of good quality used stock and the potential over-supply in the new LCV market if demand for new vehicles continues to decline. Hopefully, the just-in-time inventory systems and flexible production processes operated by vehicle manufacturers these days will have ensured they haven’t over-produced vehicles and the used LCV market won’t be put under any further pressure from further heavy discounting on new vehicles.
Trade Sales Trends and Forecast
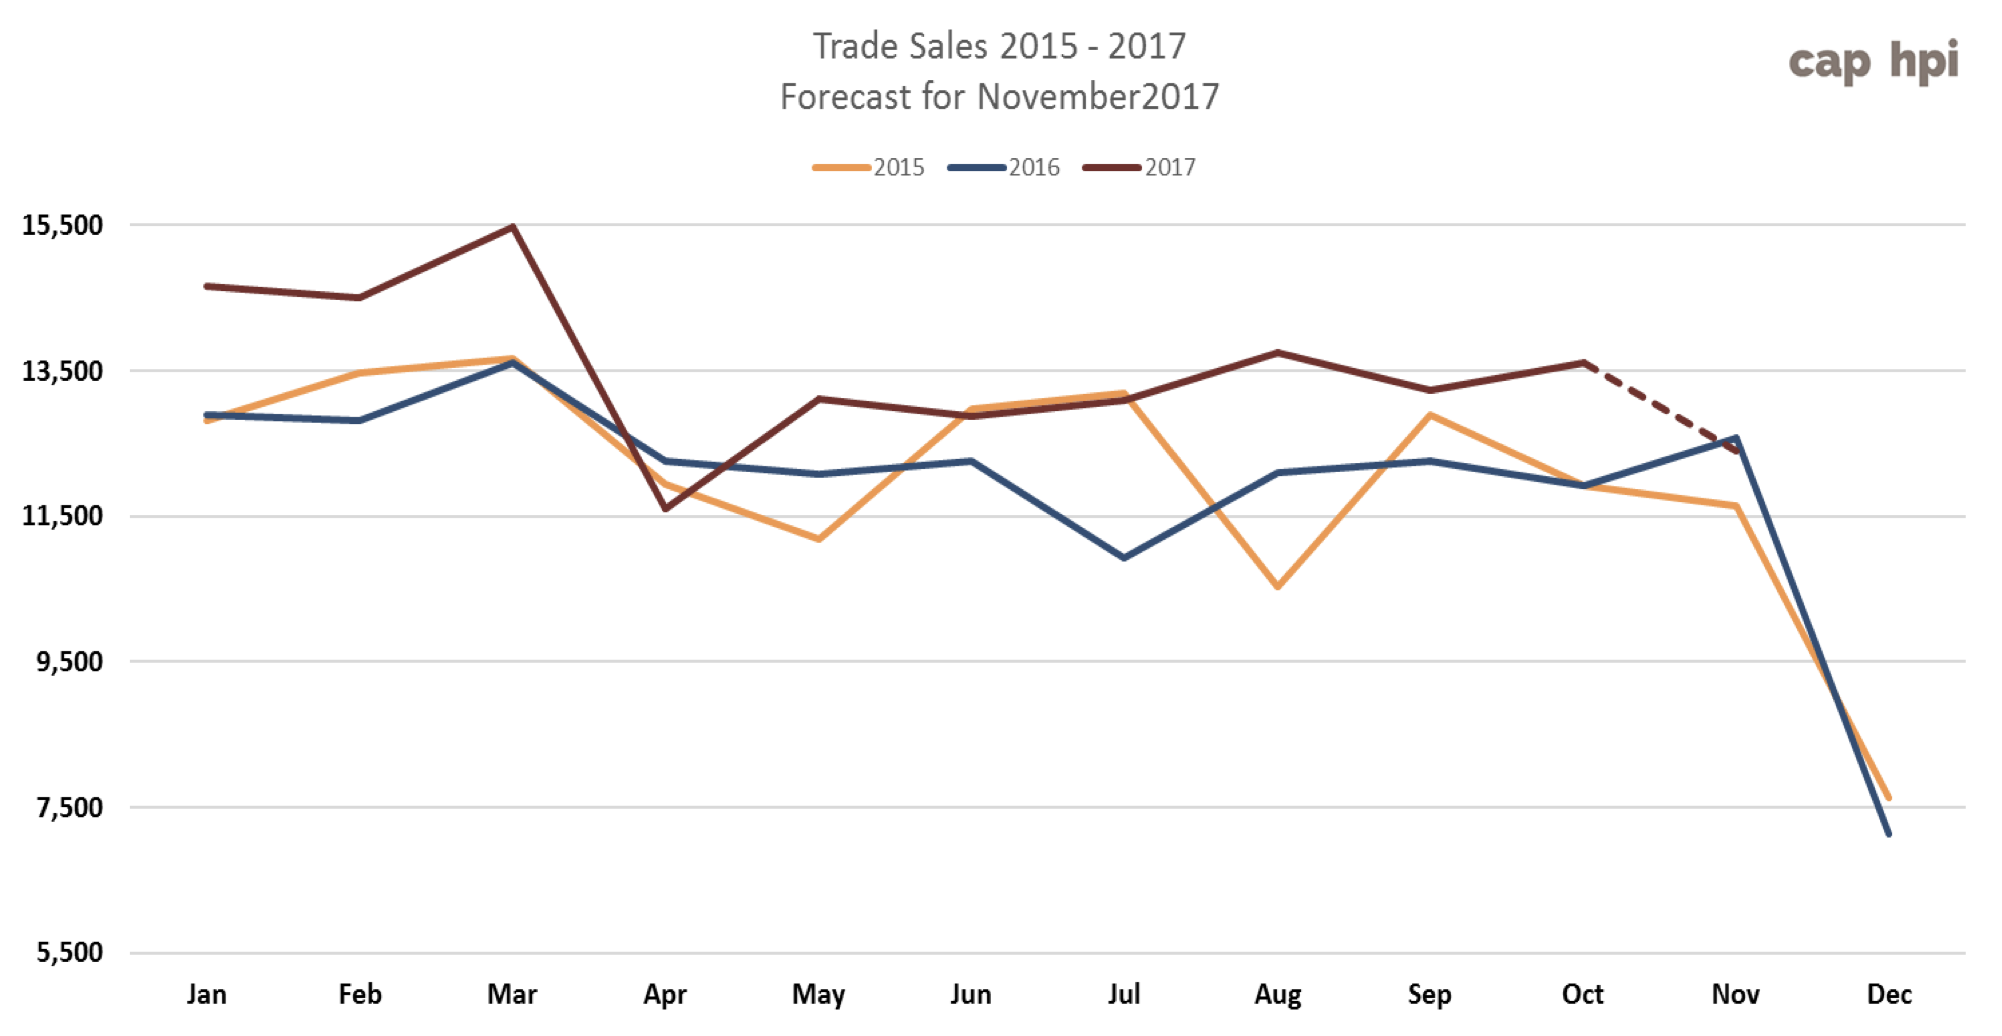
With fewer auction sales in December in the run up to the Christmas break we are expecting to see progressively lower attendance levels over the first half of the month and a corresponding downturn in sales in line with previous years. Auction entries are likely to be much lower as the whole of the vehicle remarketing sector slows down.
Market Share & Price Performance Trends across the LCV Sectors
|
September 2017 |
October 2017 |
November 2017 |
||||
|
LCV Sector |
Market Share |
Performance |
Market Share |
Performance |
Market Share |
Performance |
|
City Van |
5.42% |
98.01% |
4.74% |
99.95% |
4.11% |
98.27% |
|
Small Van |
28.72% |
98.02% |
28.92% |
98.28% |
27.14% |
98.46% |
|
Medium Van |
25.12% |
100.03% |
24.31% |
101.82% |
27.33% |
100.23% |
|
Large Van |
20.07% |
100.44% |
18.44% |
101.05% |
19.52% |
99.69% |
|
Over 3.5T |
0.18% |
106.92% |
0.18% |
102.89% |
0.24% |
101.17% |
|
4x4 Pick-up Workhorse |
1.85% |
97.24% |
1.75% |
99.57% |
2.14% |
99.63% |
|
4x4 Pick-up Lifestyle SUV |
9.78% |
100.40% |
12.84% |
99.50% |
11.38% |
98.32% |
|
Forward Control Vehicle |
0.05% |
96.13% |
0.08% |
101.25% |
0.11% |
98.01% |
|
Chassis - Derived |
5.71% |
97.83% |
6.33% |
98.68% |
5.66% |
99.90% |
|
Mini-bus |
1.44% |
96.73% |
0.90% |
97.45% |
0.78% |
97.32% |
|
Vat Qualifying |
1.62% |
99.30% |
1.41% |
99.47% |
1.42% |
98.39% |
|
Total Market |
100.00% |
99.23% |
100.00% |
99.95% |
100.00% |
99.26% |
With demand so strong last month, not surprisingly the overall price performance across most sectors hovered around 98%-99% of CAP Average with only Minibus prices showing any real sign of weakening. Consequently, we have only made marginal changes to the most of the guide prices for the December edition. As you might expect at this time of year the strengthening of prices of Medium and Large Panel van sectors has continued in line with the seasonal peak in demand for temporary contract parcel delivery owner/drivers. The 4x4 Pick-up sector remains strong despite the slight drop in price performance last month as used LCV dealers increased their stock levels in anticipation of any seasonal increase in demand.
Guide price movements by sector in this edition
|
December: LCV Used Guide Price Movements 3 year / 60k |
||
|
LCV Sector |
Average % Movement |
Average £ Movement |
|
City Van |
-0.93% |
-£30 |
|
Small Van |
-1.22% |
-£54 |
|
Medium Van |
1.11% |
£109 |
|
Large Van |
0.62% |
£50 |
|
Over 3.5T |
0.21% |
£22 |
|
4x4 Pick-up Workhorse |
0.18% |
£22 |
|
4x4 Pick-up Lifestyle SUV |
-0.75% |
-£82 |
|
Forward Control Vehicle |
0.00% |
£0 |
|
Chassis - Derived |
-0.25% |
-£22 |
|
Mini-bus |
-2.91% |
-£280 |
|
Vat Qualifying |
-1.00% |
-£108 |
How colour affects used LCV wholesale prices
It’s widely accepted within the vehicle remarketing industry that vehicles painted in certain colours retain their value better than others. Even though white remains the colour choice for most new LCV buyers, increasingly we are seeing more and more vans in other colours entering the used wholesale market. Due to the complexity of used LCV market and the sheer number LCV derivatives available, it would be impossible to produce accurate guide values for every model in every colour that’s available on the vehicle manufacturer’s price list, not to mention the bespoke colours favoured by some very large fleet operators.
Whilst Red Book will continue reflect the market prices of LCVs in white only, we cannot ignore the impact that vehicles in colours other than white is having on the used LCV market as a whole. So as we monitor wholesale transactions as part of our ongoing market research it is essential that we take into account the effect that colour has on wholesale prices.
The chart below is intended as a guide to illustrate how more or less in percentage terms you would expect to pay for a vehicle in any of the colours and vehicle sectors listed. So for example, if you were bidding on a Silver van in the City Van sector you can expect to pay on average 2.05% more than you’d pay for the same van in White - which of course is the value we publish in Red Book. I would also add that it’s the guide value of a White van that you will see printed in the auction catalogues.
It should be noted that the values shown in this table are based on actual trade sales of vehicles at open auctions and that at any given time the market values of vehicles are dependent on many other factors such as supply volume and condition. We intend reviewing this table regularly to reflect the latest market sentiment toward LCV colours and any identifiable trends in colour preferences.
|
Colours |
City Van |
Small Van |
Medium Van |
Large Van |
4x4 Workhorse |
4x4 Lifestyle |
Mini-bus |
VAT Qualifying |
|
White |
CAP Avg |
CAP Avg |
CAP Avg |
CAP Avg |
CAP Avg |
CAP Avg |
CAP Avg |
CAP Avg |
|
Silver |
2.05% |
3.29% |
2.63% |
4.59% |
0.75% |
0.87% |
-0.95% |
1.68% |
|
Blue |
-0.63% |
-0.26% |
2.22% |
0.05% |
0.97% |
0.57% |
-1.53% |
1.36% |
|
Black |
3.67% |
4.34% |
3.79% |
3.56% |
1.70% |
0.62% |
3.63% |
|
|
Grey |
4.20% |
5.03% |
4.02% |
3.39% |
1.95% |
0.93% |
4.03% |
|
|
Red |
0.31% |
-0.80% |
1.22% |
-1.56% |
0.39% |
-0.18% |
1.48% |
|
|
Yellow |
-3.43% |
-3.96% |
-6.61% |
-7.83% |
||||
|
Green |
-0.25% |
-2.49% |
-3.30% |
-2.48% |
1.11% |
-0.04% |
4.39% |
|
|
Orange |
-2.11% |
6.88% |
1.13% |
1.06% |
||||
|
Brown |
1.14% |
5.17% |
1.51% |
-1.56% |
Top 10 models driving the used LCV Market
The table below gives you a clear picture of the makes and models in the main LCV sectors that are driving the prices in the used LCV Market. Arranged in order of their respective share of total sector sales, the percentage CAP performance is based on actual recorded sales at open auctions.
Since our guide values reflect the market prices of basic vans in plain white as they appear in the vehicle manufacturer’s price lists, some of guide price movements you might see in this edition may not correlate directly with the sales performances shown in the tables since these include vehicles in all colours and specifications.
|
CAPId |
City Van |
Sector Share |
%CAP |
%CAP White Only Condition Adjusted |
||||||||
|
24217 |
NEMO DIESEL - 1.3 HDi Enterprise [non Start/Stop] |
7.58% |
97.8% |
96.2% |
||||||||
|
26324 |
FIESTA DIESEL - 1.5 TDCi Van |
6.57% |
96.3% |
100.0% |
||||||||
|
26326 |
FIESTA DIESEL - 1.6 TDCi ECOnetic Van |
4.29% |
99.6% |
100.6% |
||||||||
|
24233 |
BIPPER DIESEL - 1.3 HDi 75 Professional [non Start/Stop] |
4.29% |
98.1% |
94.0% |
||||||||
|
26328 |
FIESTA DIESEL - 1.6 TDCi Sport Van |
4.04% |
99.1% |
98.9% |
||||||||
|
26289 |
CORSAVAN DIESEL - 1.3 CDTi 16V Van |
3.79% |
97.4% |
97.5% |
||||||||
|
24216 |
NEMO DIESEL - 1.3 HDi LX [non Start/Stop] |
3.79% |
93.2% |
94.6% |
||||||||
|
11121 |
CORSAVAN DIESEL - 1.3 CDTi 16V Van |
3.28% |
79.3% |
95.3% |
||||||||
|
21678 |
ASTRAVAN DIESEL - Club 1.7 CDTi ecoFLEX Van |
3.03% |
90.8% |
104.5% |
||||||||
|
30873 |
TRANSIT COURIER DIESEL - 1.6 TDCi Trend Van |
3.03% |
101.0% |
97.0% |
||||||||
|
Market Prices Down -1% Sales of City Vans were down slightly in November and prices weakened slightly with the average performance running at 98.27%. After taking into account colour and the condition the guide values for most models in this sector have gone down by 1% in this edition apart from the following model ranges.
|
||||||||||||
CAPId
Small Van
Sector Share
%CAP
%CAP White Only Condition Adjusted
18445
BERLINGO L1 DIESEL - 1.6 HDi 625Kg Enterprise 75ps
11.36%
98.9%
96.9%
20709
CADDY MAXI C20 DIESEL - 1.6 TDI 102PS Van
11.05%
98.9%
96.6%
22432
PARTNER L1 DIESEL - 850 S 1.6 HDi 92 Van [SLD]
2.24%
97.5%
95.6%
26630
KANGOO DIESEL - ML19dCi 75 eco2 Van
2.06%
99.7%
100.1%
15182
BERLINGO L1 DIESEL - 1.6 HDi 625Kg LX 75ps
2.01%
101.0%
96.7%
26689
TRANSIT CONNECT 200 L1 DIESEL - 1.6 TDCi 115ps Limited Van
2.01%
100.6%
99.0%
16534
TRANSIT CONNECT 200 SWB DIESEL - Low Roof Van TDCi 75ps
1.97%
95.1%
95.7%
28266
CADDY C20 DIESEL - 1.6 TDI 102PS Startline Van
1.92%
98.1%
95.9%
26672
TRANSIT CONNECT 200 L1 DIESEL - 1.6 TDCi 75ps Van
1.83%
93.1%
93.1%
16514
TRANSIT CONNECT 230 LWB DIESEL - High Roof Van TDCi 90ps
1.83%
93.7%
100.0%
Market Prices Down -1%
Sales of Small Vans were down by just under 7.5% last month whilst price performance remained much the same as last month at 98.46%. After taking into account colour and condition the guide values for most models in this sector have moved downwards by 1% in this edition. New shape TRANSIT CONNECT 200 L1 DIESEL 75ps Van remains an enigma as our research evidence clearly shows that trade buyers are paying more for the earlier 1.6 engine diesel models than the later 1.5 engine models. Since the aim of Red Book is to reflect market sentiment for all makes and models we have no option but to price these models accordingly.
FIAT DOBLO CARGO E6 (16- ) DROP (0%)
FORD CONNECT (09-13) T200-T230 VAN (0%)
FIAT DOBLO CARGO E6 (16- ) VAN (0%)
PEUGEOT PARTNER (08-17) VAN (0%)
FORD CONNECT (13- ) T200-T240 VAN (-2%)
RENAULT KANGOO (13-17) (0%)
M-B CITAN (13- ) (-3%)
VAUXHALL COMBO (12-17) VAN (-2%)
NISSAN NV200 (09- ) (0%)
FORD CONNECT (02-07) T200 PET VAN (-2%)
RENAULT KANGOO E6 (16- ) (0%)
FORD CONNECT (02-08) T210 PET VAN (-2%)
VAUXHALL COMBO E6 (16- ) VAN (0%)
FORD CONNECT (02-09) T200-T230 VAN (-2%)
CITROEN BERLINGO (08- ) VAN (-4%)
FORD CONNECT (06-07) T210 VAN (-2%)
FIAT DOBLO (10- ) COMBI (0%)
RENAULT KANGOO (08-13) VAN (0%)
FIAT DOBLO CARGO (10- ) PET VAN (0%)
VAUXHALL COMBO (01-10) PET VAN (0%)
FIAT DOBLO CARGO (10- ) VAN (0%)
VAUXHALL COMBO (01-12) VAN (0%)
FIAT DOBLO CARGO (11- ) DROP (0%)
VW CADDY (04-10) C20 VAN (0%)
CAPId
Medium Van
Sector Share
%CAP
%CAP White Only Condition Adjusted
24636
TRANSPORTER T28 SWB DIESEL - 2.0 TDI BlueMotion Tech 84PS Van
6.33%
110.6%
109.8%
25441
TRANSIT CUSTOM 270 L1 DIESEL FWD - 2.2 TDCi 125ps Low Roof Limited Van
4.21%
97.4%
98.2%
25437
TRANSIT CUSTOM 270 L1 DIESEL FWD - 2.2 TDCi 100ps Low Roof Van
3.32%
95.2%
95.8%
24314
VIVARO SWB DIESEL - 2.0CDTI [115PS] ecoFLEX Van 2.9t Euro 5
3.05%
92.7%
106.6%
25446
TRANSIT CUSTOM 290 L1 DIESEL FWD - 2.2 TDCi 100ps Low Roof Van
2.74%
94.9%
94.3%
18442
DISPATCH L1 DIESEL - 1000 1.6 HDi 90 H1 Van Enterprise
2.70%
97.4%
97.8%
25475
TRANSIT CUSTOM 290 L2 DIESEL FWD - 2.2 TDCi 125ps Low Roof Limited Van
1.77%
96.4%
98.7%
31669
VIVARO L2 DIESEL - 2900 1.6CDTI 115PS Sportive H1 Van
1.77%
96.2%
96.2%
24329
VIVARO LWB DIESEL - 2.0CDTI [115PS] Sportive Van 2.9t Euro 5
1.68%
99.0%
101.6%
24325
VIVARO LWB DIESEL - 2.0CDTI [115PS] Van 2.9t Euro 5
1.59%
104.4%
102.0%
Market Prices Level 0%
Medium Van sales were down by 7.5% last month whilst price performance remained relatively stable at 100.23%. After taking into account colour and condition the guide values for most models in this sector remain the same as last month, however, there are some significant prices changes for the following model ranges.
RENAULT TRAFIC E6 (16- ) dCi VAN (-2%)
RENAULT TRAFIC (08-09) dCi FRIDGE (-1%)
VW T6 TRANSPORTER E6 (16- ) VAN (-1%)
VW T5 TRANSPORTER (03-14) FRIDGE (-1%)
VW T6 TRANSPORTER PETROL (16- ) VAN (-1%)
VW T5 TRANSPORTER (10-15) VAN (2%)
FORD TRANSIT CUSTOM VAN (12-17) (-1%)
M-B VITO (05-07) PET VAN (-2%)
RENAULT TRAFIC (14-16) dCi VAN (-2%)
M-B VITO (96-03) PET VAN (-2%)
VAUXHALL VIVARO (14-16) VAN (1%)
M-B VITO (96-03) VAN (-2%)
VW T6 TRANSPORTER (15-16) VAN (-1%)
RENAULT TRAFIC (01-06) dCi VAN (-1%)
M-B VITO (03-10) CDi VAN (-2%)
RENAULT TRAFIC (01-07) PET VAN (-1%)
M-B VITO (03-10) DUALINER VAN (-2%)
VW T4 TRANSPORTER (96-04) VAN (-1%)
M-B VITO (96-03) FRIDGE (-2%)
VW T5 TRANSPORTER (03-10) VAN (-1%)
RENAULT TRAFIC (06-14) dCi VAN (1%)
CAPId
Large Van
Sector Share
%CAP
%CAP White Only Condition Adjusted
30637
TRANSIT 350 L3 DIESEL RWD - 2.2 TDCi 125ps H3 Van
3.57%
95.4%
96.5%
9104
TRANSIT 260 SWB DIESEL FWD - Low Roof Van TDCi 85ps
3.14%
92.9%
102.5%
26863
SPRINTER 313CDI LONG DIESEL - 3.5t High Roof Van
2.97%
105.6%
105.4%
22130
TRANSIT 280 SWB DIESEL FWD - Low Roof Van ECOnetic TDCi 100ps
2.54%
102.2%
100.9%
9166
TRANSIT 300 SWB DIESEL FWD - Low Roof Van TDCi 85ps
2.22%
102.0%
102.3%
22246
TRANSIT 350 LWB DIESEL RWD - High Roof Van TDCi 125ps
2.06%
91.3%
96.4%
9155
TRANSIT 280 SWB DIESEL FWD - Low Roof Van TDCi 85ps
2.00%
90.6%
98.0%
21705
CRAFTER CR35 LWB DIESEL - 2.0 TDI 136PS High Roof Van
1.95%
102.7%
102.8%
22173
TRANSIT 330 SWB DIESEL FWD - Low Roof Van TDCi 125ps
1.78%
97.3%
101.2%
22129
TRANSIT 280 SWB DIESEL FWD - Low Roof Van TDCi 100ps
1.78%
101.6%
98.9%
Market Level 0%
Whilst the Large Van market share of total LCV sales was down slightly compared to last month in real terms actual sales of panel vans were up by just over 8%. With sales performance for most models in this sector remaining strong at 99.69% the guide values most model ranges are unchanged in this edition with the following notable exceptions.
PEUGEOT BOXER E6 (16- ) VAN (1%)
FORD TRANSIT (01-06) PET VAN (-5%)
M-B SPRINTER (13- ) 2-SERIES VAN (2%)
IVECO DAILY (06-09) 3.5t VAN (-1%)
M-B SPRINTER (13- ) 3-SERIES VAN (2%)
IVECO DAILY (06-09) VAN (-1%)
NISSAN INTERSTAR (02-04) VAN (-1%)
IVECO DAILY (99-04) C CLASS VAN (-1%)
NISSAN INTERSTAR (03-11) VAN (-1%)
IVECO DAILY (99-04) S CLASS VAN (-1%)
PEUGEOT BOXER (14-16) VAN (1%)
IVECO DAILY (99-05) L CLASS VAN (-1%)
LDV MAXUS (05-09) Van (-1%)
IVECO DAILY CNG (04-07) VAN (-1%)
PEUGEOT BOXER (06-14) VAN (1%)
LDV CONVOY (01-06) VAN (-1%)
RENAULT TRUCKS MASCOTT (07-10 ) VAN (-1%)
LDV CONVOY (02-06) LPG VAN (-1%)
VW CRAFTER (06-17) VAN (2%)
M-B SPRINTER (00-06) PET VAN (-1%)
VW LT (96-07) VAN (-1%)
M-B SPRINTER (00-06) VAN (-1%)
FORD TRANSIT (00-06) T260 T280 T300 VAN (-5%)
M-B SPRINTER (95-06) PET VAN (-1%)
FORD TRANSIT (00-06) T330 T350 T350EL VAN (-5%)
PEUGEOT BOXER (02-07) VAN (1%)
CAPId
4x4 Pick-up Lifestyle SUV
Sector Share
%CAP
%CAP All Colours Condition Adjusted
18622
L200 LWB LB DIESEL - Double Cab DI-D Barbarian 4WD 176Bhp
6.13%
99.1%
95.6%
25079
AMAROK A32 DIESEL - D/Cab Pick Up Highline 2.0 BiTDI 180 BMT 4MTN Auto
5.24%
99.7%
99.7%
21668
HILUX DIESEL - Invincible D/Cab Pick Up 3.0 D-4D 4WD 171
4.91%
103.6%
99.7%
22419
RANGER DIESEL - Pick Up Double Cab Wildtrak 3.2 TDCi 4WD Auto
4.24%
96.1%
96.1%
22415
RANGER DIESEL - Pick Up Double Cab Limited 2.2 TDCi 150 4WD
4.24%
96.3%
96.3%
22418
RANGER DIESEL - Pick Up Double Cab Wildtrak 3.2 TDCi 4WD
3.79%
97.0%
97.0%
19137
NAVARA DIESEL - D/Cab Pick Up Tekna [Connect] 2.5dCi 190 4WD
3.79%
97.4%
95.4%
19135
NAVARA DIESEL - Double Cab Pick Up Tekna 2.5dCi 190 4WD
3.34%
104.2%
97.3%
18623
L200 LWB LB DIESEL - Double Cab DI-D Barbarian 4WD Auto 176Bhp
3.01%
102.7%
101.1%
18672
L200 LWB LB DIESEL - D/Cab DI-D Warrior II 4WD 176Bhp [2010]
2.90%
110.2%
100.4%
Market -1%
Last month’s sales of Lifestyle Pick-ups were relatively flat for this time of the year with only 9 more vehicles sold that the previous month. Price performance wavered slightly at 98.32% of the guide prices. Consequently the guide values for most model ranges in this sector remain have gone down by 1% in this edition with the following notable exceptions.
FORD RANGER (15- ) PICK-UP LIFE (1%)
MITSUBISHI L200 (06-16) DI-D LIFE (0%)
ISUZU D-MAX DIESEL (17- ) (0%)
VW AMAROK (11-17) LIFE (0%)
VW AMAROK (16- ) LIFE (0%)
FORD RANGER (09-11) LIFE (0%)
FORD RANGER (11-16) PICK-UP LIFE (-3%)
TOYOTA HILUX (01-10) PICK-UP LIFE (0%)
ISUZU D-MAX DIESEL (12- ) (0%)
TOYOTA HILUX (93-01) PICK-UP LIFE (0%)
ISUZU RODEO (07-12) LIFE (2%)
HGV MARKETPLACE
CAPId
4x4 Pick-up Workhorse
Sector Share
%CAP
%CAP All Colours Condition Adjusted
21665
HILUX DIESEL - HL2 D/Cab Pick Up 2.5 D-4D 4WD 144
8.59%
94.3%
98.1%
30784
HILUX DIESEL - Active D/Cab Pick Up 2.5 D-4D 4WD 144
6.75%
98.2%
100.7%
18668
L200 LWB LB DIESEL - Double Cab DI-D 4Work 4WD 134Bhp [2010]
6.13%
93.8%
92.2%
26500
NAVARA DIESEL - Double Cab Pick Up Visia 2.5dCi 144 4WD
5.52%
97.6%
97.6%
22413
RANGER DIESEL - Pick Up Double Cab XL 2.2 TDCi 150 4WD
4.29%
92.4%
92.4%
21663
HILUX DIESEL - HL2 Pick Up 2.5 D-4D 4WD 144
4.29%
101.4%
105.3%
11073
DEFENDER 110 LWB DIESEL - Hard Top TDCi
4.29%
93.1%
96.2%
16571
RANGER DIESEL - Pick Up Double Cab XL 2.5 TDCi 4WD
3.68%
77.4%
85.9%
24963
D-MAX DIESEL - 2.5TD Double Cab 4x4
3.68%
99.2%
99.2%
11045
HILUX DIESEL - HL2 D/Cab Pick Up 2.5 D-4D 4WD 120
3.68%
90.9%
100.3%
Market Level 0%
Whilst at 2.14% market share, sales of 4x4 Workhorse Pick-ups still only accounted for a relatively small proportion of the total LCVs sold last month actual sales were up by over 21%. Although Land Rover Defenders continued to dominate this sector, thy sold in a similar numbers to last month. The increased sales volume was largely down to Hilux, Ranger and L200 which were clearly being sold in larger numbers. The guide prices for most models in this sector are unchanged this month with the following notable exceptions.
DACIA DUSTER (15- ) (2%)
NISSAN NAVARA (13-16) PICK UP (-1%)
LAND ROVER (11-16) DEFENDER 90 110 130 TDCi (1%)
FORD RANGER (02-06) PICK-UP WORK (-2%)
MITSUBISHI L200 (10-16) DI-D WORK (-3%)
FORD RANGER (05-06) CHASSIS (-2%)
FORD RANGER (11-16) CHASSIS WORK (-1%)
FORD RANGER (06-09) CHASSIS (-2%)
FORD RANGER (11-16) PICK-UP WORK (-1%)
FORD RANGER (06-09) PICK-UP WORK (-2%)
LAND ROVER (07-11) DEFENDER 90 110 130 TDCi (1%)
FORD RANGER (06-09) TIP (-2%)
MITSUBISHI L200 (06-10) DI-D WORK (-3%)
FORD RANGER (99-02) PICK-UP WORK (-2%)
FORD RANGER (09-11) CHASSIS (-2%)
LAND ROVER (98-06) DEFENDER 110 Td5 (1%)
FORD RANGER (09-11) PICK-UP WORK (-2%)
LAND ROVER (98-06) DEFENDER 130 Td5 (1%)
FORD RANGER (09-11) TIP (-2%)
LAND ROVER (98-07) DEFENDER 90 Td5 (1%)
LAND ROVER (05-07) DEFENDER 110 Td5 (1%)
LAND ROVER (98-99) DEFENDER 90 PET (1%)
LAND ROVER (06-07) DEFENDER Td5 130 (1%)
MITSUBISHI L200 (01-04) TD/TD 113 WORK (-3%)
MITSUBISHI L200 (04-07) TD/TD 113 WORK (-3%)
Auction stocks remain lower than at this time last year but buyers continue to attend auctions in numbers and on the day sales remain strong, as does the conversion rates of provisional sales. There is also less stock circulating the auctions time after time and those vehicles that do are usually beyond a useful future life.
A current issue for some auctions is obtaining stock to sell, but that is often the case at this time of the year and post-Christmas there is usually an increase in new stock as fleets are reduced.
Auctions appear to have a growing band of internet bidders. This could be a good thing saving those buyers’ hours of both travelling time and the time that they are away from their office, or is it? Tales of successful internet bidders being unhappy with their internet purchases leads one to ask if they fully researched the vehicle prior to purchase. As all auction sales are ‘sold as seen’ it is vitally important that prospective buyers inspect vehicles prior to bidding in order to ensure that it fully meets their expectations.
The Ultra-low emission zone in London due to be implemented in April 2019 and the subsequent expansion of the zone, along with similar new zones expected to be implemented across other towns and cities will ensure that Euro 6 rigids remain sought after. Tractor Units on the other hand will be less affected and values may start to soften as more appear in the open market.
Alternative fuel vehicles are also starting to appear on the road in numbers but at present the infrastructure required to operate such vehicles is not widely available. Only major operators who can install the necessary ‘refuelling’ facilities and also carefully schedule routes can operate such vehicles. Doubtless as legislation changes and technology advances these vehicles will become more common, potentially replacing diesel vehicles in years to come but for now we will continue to concentrate on diesel versions.
Dealer’s report that it is still fairly quiet with incoming enquiries falling as we near Christmas, whilst manufacturers continue to control their returning stocks and record good sales especially for Euro 6 vehicles.
Records from our auction visits indicate that the average number of auction entries remained steady last month. The number of on-the-day sales of trucks fell slightly by just over 1% in relation to total entries whilst trailer sales continued at the same level. This is based on three auction visits and a total of 353 viewed lots. As we always point out these are ‘hammer sales’ on-the-day and converted provisional sales are not included. One auction reports that the conversion rate of provisional sales remains at last month’s level of around 60%.
This month’s research indicates that:
- Up to 7.5t – A slight reduction on some values.
- 5t to 12t – Here too a slight reduction in most values.
- 13t to 18t – Euro 5 values have fallen a little across the board.
- Multi-wheel rigids – Again, a slight reduction in Euro 5 values.
- Tractor units – 4x2 Tractor units have remained steady whereas there has been a small decrease in values for most Euro 5 models.
- Trailers – Values have remained stable.
7.5t to 12t Vehicles
Activity in this sector has increased recently but values remain under pressure. Plenty more Euro 5 7.5t boxes have flowed into the market which are predominantly 2012 and 2013 DAF’s, although a good selection of Mercedes-Benz 816 have also joined them. Most good examples did sell and in some cases values were up slightly early in the month, but that may reflect last minute buying to fulfil seasonal orders because values fell away again as the month progressed. Older boxes remain plentiful so buyers continue to have a good selection to choose from.
A significant number of Euro 4 fridges have appeared again, particularly on Mercedes chassis and have become less desirable due to their poor quality, which has hindered their sale values. Whilst this may have provided plenty of choice for buyers it has put pressure on values.
An equally large batch of tippers on a variety of chassis’s but primarily Euro 4 and 5 DAF, Iveco and Mercedes-Benz, proved popular lots but with so much choice prices may eventually suffer. However, even when accounting for seasonality tippers continue to remain desirable.
Due to their current scarcity dropsides continue to attract additional interest as have vehicles which are non-standard or are fitted with cranes.
Car transporters continue to provoke good interest, and several mainly Mercedes-Benz Atego 7.5t and 10t day cab double deck examples from a respected lease company were offered during the month.
13t to 18t Vehicles
This workhorse sector continues to fare reasonably. Late examples in various guises, whilst thin on the ground generally sell well when they appear. Vehicles with plough attachments and tipper / gritter bodies have been appearing in increasing numbers recently and the time of the year has increased the possibility of them finding new homes.
Refuse trucks have also been selling, unlike their multi-wheel sisters, but specification is essential to realise best value. Older examples are often seen as only chassis cabs.
Platforms and curtains have performed reasonably, whilst boxes are finding some difficulty finding new homes unless they are particularly tidy or with low kilometres. Fridges have struggled a little with even tidy examples failing to find new homes.
Tippers are relatively scarce and those that have appeared were received well. Skip loaders have been in good supply of late and good examples are usually snapped up.
Multi-wheelers
Double drive vehicles of all types, with the exception of refuse trucks, usually attract good interest and apart from tippers there is insufficient quality stock at present to satisfy the market.
Refuse trucks mainly on Dennis or Mercedes-Benz Econic chassis continue to appear in numbers and are met with indifferent interest with anything over seven years of age often struggling to attract a reasonable offer. Due to their high capital cost vendors may have unrealistic expectations and consequently many struggle to find buyers. That considered a 2014 14 plate Dennis Elite 6 8x4 tridem with Dennis body and Terberg bin lifts and only 34,500 kms achieved a bid of £67,000 at auction recently.
Similar could be said for car transporters and some bespoke built vehicles which have little attraction as second life vehicles. A further selection of car transporters appeared recently, on a variety of chassis and of varying ages but most examples failed to meet the reserve price. Occasionally one turns up that does turn heads and that happened when a very tidy 2013 13 plate sleeper cab DAF FA CF85.460 rig with a Lohr tandem trailer with 411,000 kms reached a bid of £24,500. It didn’t sell and at a subsequent sale it achieved only £19,500
The availability of 8x4 tippers continues unabated and whilst sales remain steady especially for those fitted with cranes and grabs where age is not always a barrier to a successful outcome. Irrespective of application or specification the onset of autumn is having little effect in supressing interest.
Somewhat surprisingly older vehicles often stimulate good interest and this happened when a 1990 H plate sleeper cab Volvo F12 23 tonne 6x2 flat with Hiab crane appeared; bidding reached a high of £7,100.
Boxes continue to be remain scarce compared to curtains and fridges, which remain in good supply although values are diminishing across the board.
Flats and dropsides continue to appear in numbers, with those carrying cranes generally being the most desirable and the heftier the crane the better.
Tractor Units
The oversupply of Euro 5 6x2 tractor units into the marketplace continues, partly due to a supressed export market and the desire for more fuel efficient Euro 6 products vehicles which would have sold more easily just few months ago are often struggling to find buyers.
The large volumes four and five year old 6x2 Renault Premium 460’s with Privilege cabs seems to be slowly coming to an end and their values are beginning to stabilise.
Buyers do continue to show some interest and good specification Scania’s and Volvo’s are performing reasonably well at present but most other vehicles continue to see values fall away a little.
As always anything late registered with a large cab provokes strong interest. Factor in high horsepower, low kilometres and good condition and bids are guaranteed to be strong. The complete lack of such vehicles in any numbers keeps interest keen.
In summary, the values of 4x2 tractor units remain reasonably steady and pre Euro 5 6x2 tractor units are selling at present but the usual caveats referring to age mileage and condition need to be applied. Euro 5 vehicles have seen a slight decrease in value with the exception of the aforementioned Scania and Volvo’s. 6x4 tractor units remain scarce and always attract attention when they appear.
Trailers
Platforms, especially PSK’s, have been selling strongly of late and a little unexpectedly for the time of year, research indicates that values for boxes and curtains appear to be softening whilst fridges and skeletals are attracting increased interest. We will keep our eye on this to see what happens post-Christmas before making any further pricing movements.
Sentiment suggests that the trailer market remains steady and as previously mentioned the best examples which are ready to work are selling but those in poorer condition and requiring work before use are struggling to sell at anything like their true value.

